Why The 4% Retirement Rule Is Trash (It’s Not What You Think)
When it comes to retirement planning, the main litmus test that has been used since the late 1990s is called the 4% rule. This rule was based on a study done by 3 economists who looked at historic 30 year retirement periods, running from 1925 to 1975 (later updated to cover through 2009). They found that a mix of 75% stocks and 25% bonds was successful 100% of the time with a 4% yearly withdrawal rate, adjusted for inflation each year. Success was determined by there being a positive amount of money at the end of the year.
Recently Dave Ramsey went on a rant about the 4% rule, and other financial “experts” claiming that the 4% rule isn’t conservative enough who believe that a 3% rule is the way to go. Dave claims that the S+P 500 has returned 12% on average over the last 100 years and if inflation averages 4%, then there is an 8% real return, and that is what retirees can plan to withdrawal every year.
I agree with Dave that a 4% rule is too conservative, and I disagree with Dave, because I think an 8% rule is too aggressive. I also think that ANY simplistic rule to follow for withdrawing retirement funds is deeply flawed.
Why Do We Save For Retirement?
We save for retirement in order to turn that nest egg into cash flow to live off of in old age. That cash flow replaces active income. The goal is to save enough money to fully replace our active income, which results in a daunting total nest egg number. To Dave’s point, the 4% rule can be discouraging to people because the math results in a very large number. If the goal is to replace an income of $50,000 a year, following the 4% rule requires a nest egg of $1,250,000. If the goal is instead the 8% that Dave recommends withdrawing the nest egg needs to only be $625,000 to provide the same cash flow.
Why Automatic withdrawal rates are wrong:
Sticking with an automatic withdrawal rate is wrong because it requires large withdrawals in down years, which damage the portfolio greatly, but also doesn’t take advantage of withdrawals in high years, where there is plenty of bounty. Retirement withdrawals should be highly variable every year to account for market performance, actual cash needs, and tax situations.
How much time and effort goes into building our retirement funds? For the average person this is roughly a 10% contribution for 40 years. We work about 2,000 hours a year, so 10% would be 200 hours per year, times 40 years would be 8,000 hours of time put into building our nest eggs. Surely we can do at least 80 hours, 2 weeks, of thinking on how to actually use that money we spent 40 years building. Blindly following a TV soundbite for such an important concept is nuts.
What the 4 Percenters Don’t Tell You:
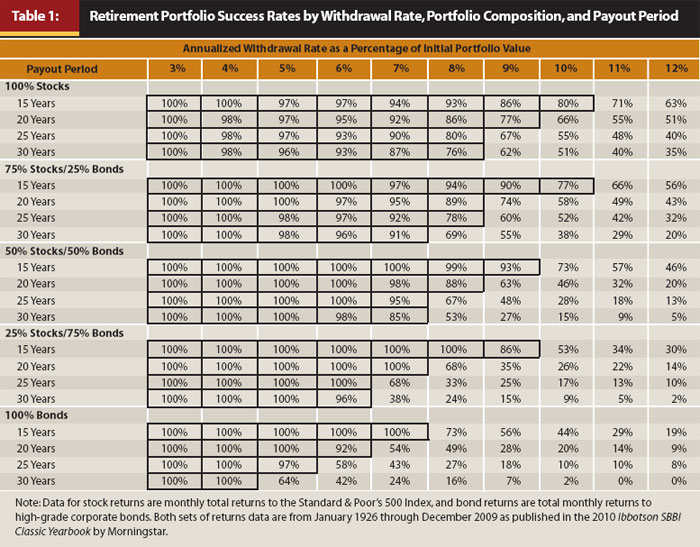
The 4% crowd, and now the 3% crowd fail to tell you is that there is more data to be gleaned from the Trinity study than just the soundbite of “withdrawal 4% and you will be fine”. In the total updated data set there are 55 30 year periods. A 75% stock 25% bond portfolio was successful:
- 100% of the time with 3% withdrawals
- 100% of the time with 4% withdrawals
- 98% of the time with 5% withdrawals
- 96% of the time with 6% withdrawals
- 91% of the time with 7% withdrawals
- 69% of the time with 8% withdrawals
These periods included retirements that started at the onset of the great depression. With each year being roughly 2%, not retiring at the start of the great depression would result in 100% success rates up to 7% withdrawal rates. This is still with blindly withdrawing that percentage rate every year regardless of what is happening. (I also analyze this deeper here)
What they also don’t tell you is what the median ending portfolio balance was for these portfolios. For portfolios with a 75% stock 25% bond allocation at the end of 30 years the median account had this much remaining for every $1,000 at the start:
- 3% $12,765
- 4%: $10,743
- 5%: $8,728
- 6%: $5,210
- 7%: $3,584
- 8%: $2,262
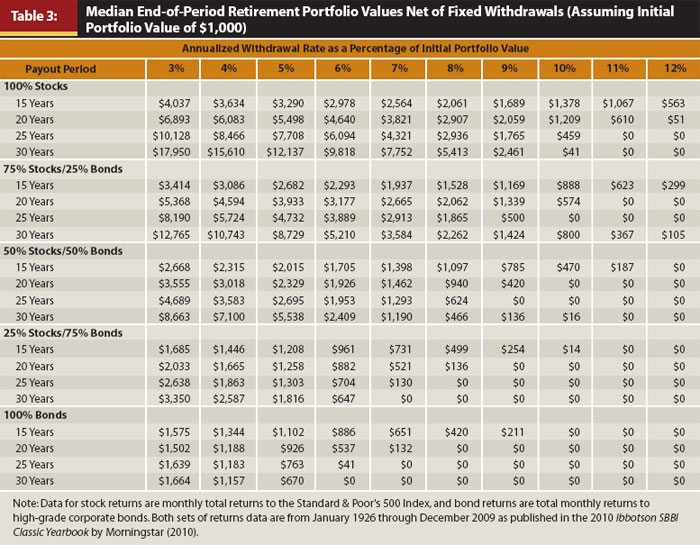
The median person retiring with $1,000,000 and following the 4% rule, with a 30 year retirement would end that retirement with $10.7 Million. This is why the 4% rule is extremely conservative.
Another point against the 4%ers: Most retirements are not for 30 years. The average retirement age in the US is 64, with the average life expectancy being 78, this is a 14 year retirement. If we back up to a 20 year retirement the study shows a 95% success rate for a 7% withdrawal rate and an 89% success rate for an 8% withdrawal rate. With a 20 year time horizon the success rate for an 8% withdrawal rate increased from 69% to 89%.
Final Point: Not only do they suggest blindly applying a withdrawal rate, the 4% rule suggest blindly applying that to the first year and NEVER adjusting it. Rather than taking 4% of the remaining balance each year, they suggest taking 4% of the initial balance each year. This is what ACTUALLY creates the series of return risk, not the returns themselves. By switching to withdrawing an amount based on the remaining balance each year, the portfolio will be able to weather bad years.
For a portfolio that started in 1929 (see the great depression) we see 5% withdrawals failing in 1944, but the writing was on the wall long before then. If instead they had adjusted to the great depression like every single person had to do, they would have withdrawn far less while the market was down, and their nest egg would have survived.
What Dave Ramsey Gets Wrong:
(Yes I know Dave Ramsey doesn’t care what I think!) An 8% withdrawal rate for an average retiree has a historic 11% failure rate when adjusting down to a 20 year retirement. I think we can write off 6% as being the first 3 years of the great depression, giving us a failure rate of only 5% in non extraordinary times. A 95% historic success rate is pretty darn good. IF I were to recommend a set percentage I would certainly recommend a 7% withdrawal rate from the numbers above. When discounting that 6% for the first 3 years of the great depression we go up to a 97% success rate for a 30 year retirement.
There is also a law of diminishing returns for increasing the withdraw rate. Using the earlier example of a desired $50,000 total withdrawal, here are the nest eggs needed:
- 3% $1,667,000
- 4% $1,250,000 (Delta from 3%: $417,000)
- 5% $1,000,000 (Delta from 4%: $250,000)
- 6% $833,000 (Delta from 5%: $167,000)
- 7% $714,000 (Delta from 6%: $119,000)
- 8% $625,000 (Delta from 7%: $89,000)
With just waiting 1 more year to retire with saving nothing else, a portfolio will grow from $625,000 to $700,000 at 12%. That is the cost of going from an 8% rate to a 7% rate, 1 more year of work for a 22% increase in success rate (69% to 91%).
To get to a 4% rate would take an additional 5 more years to reach retirement. This is trading 5 years for a 9% increase in success rate, which is certainly not as good of a deal as that first trade of 1 year for 22%.
What Both Plans Need:
The true successful retirement plan will take out more money in good years and less money in bad years. By making 2 changes, we can ensure the portfolio will last for 30 years, and allow more total cash flows during retirement. The idea is to withdrawal a set percentage of the remaining balance each year (not the amount at the start of retirement) AND withdrawal a smaller rate in bad years.
- Market returns of -20% or more: 2% withdraw rate
- Market returns of 0% to -20%: 3% withdraw rate
- Market returns of 0% to 10%: 4% withdraw rate
- Market returns of 10% to 15%: 5% withdraw rate
- Market returns of 15% to 20%: 6% withdraw rate
- Market returns of 20%+: 7% withdraw rate
In the bad years it may be necessary to do some part time work to get by.
Data sets:
I used the already inflation adjusted data for running these scenarios. I also used a 100% stock portfolio. We will have our retiree Bill retire in 1929, right after the market had a great year returning a real 45.49%. Bill is high on life and his portfolio just hit $1,000,000! Life is good. Little does Bill know, but this is the absolute worst year to retire in history.
Chart 1: Bill will do what the Trinity Study shows and Blindly withdrawing 5% of the starting balance at the start of 1929 and every year going forward. No adjustments are made:
| inflation adj. | |||||
| balance | Withdrawal % | Withdrawal $ | real return | End Balance | |
| 1928 | 687333 | 0.00% | $0 | 45.49% | $1,000,001 |
| 1929 | 1,000,001 | 5.00% | $50,000 | -8.83% | $866,116 |
| 1930 | 866,116 | 5.00% | $50,000 | -20.01% | $652,811 |
| 1931 | 652,811 | 5.00% | $50,000 | -38.07% | $373,321 |
| 1932 | 373,321 | 5.00% | $50,000 | 1.82% | $329,205 |
| 1933 | 329,205 | 5.00% | $50,000 | 48.85% | $415,597 |
| 1934 | 415,597 | 5.00% | $50,000 | -2.66% | $355,872 |
| 1935 | 355,872 | 5.00% | $50,000 | 42.49% | $435,837 |
| 1936 | 435,837 | 5.00% | $50,000 | 30.06% | $501,820 |
| 1937 | 501,820 | 5.00% | $50,000 | -37.13% | $284,059 |
| 1938 | 284,059 | 5.00% | $50,000 | 32.98% | $311,252 |
| 1939 | 311,252 | 5.00% | $50,000 | -1.10% | $258,378 |
| 1940 | 258,378 | 5.00% | $50,000 | -11.31% | $184,811 |
| 1941 | 184,811 | 5.00% | $50,000 | -20.65% | $106,972 |
| 1942 | 106,972 | 5.00% | $50,000 | 9.30% | $62,271 |
| 1943 | 62,271 | 5.00% | $50,000 | 21.47% | $14,905 |
| 1944 | 14,905 | 5.00% | $50,000 | 16.36% | -$40,836 |
Bill runs out of money at the end of 1943. Failure occurs just 14 years in. How could this have been prevented? Well for starters, Bill could have decided to not pretend the great depression wasn’t happening! Everyone else had to adjust to market conditions, except for Bill! By 1933 he is withdrawing $50,000 a year, when his balance is down to $329,000. This is taking 15% of the balance out! This is obviously not sustainable, but he does it anyway. This is madness.
The Trinity Study goes super conservative to allow someone to act blindly and completely disconnected from the world. With using a 100% stock allocation even 4% is not safe, as the series of return risk becomes higher. This is why we see people talking about a 3.5% or 3% safe withdrawal rate. For Bill’s portfolio to make it 30 years with this madness, his withdrawal rate would need to be 3.4% of his original balance.
Scenario 2: Bill only withdrawal 3.4% of his initial portfolio each year in order to have a positive remaining balance at the end of 30 years.
| inflation adj. | |||||
| balance | Withdrawal % | Withdrawal $ | real return | End Balance | |
| 1928 | 687333 | $0 | 45.49% | $1,000,001 | |
| 1929 | 1,000,001 | $34,000 | -8.83% | $880,703 | |
| 1930 | 880,703 | $34,000 | -20.01% | $677,278 | |
| 1931 | 677,278 | $34,000 | -38.07% | $398,382 | |
| 1932 | 398,382 | $34,000 | 1.82% | $371,014 | |
| 1933 | 371,014 | $34,000 | 48.85% | $501,645 | |
| 1934 | 501,645 | $34,000 | -2.66% | $455,205 | |
| 1935 | 455,205 | $34,000 | 42.49% | $600,176 | |
| 1936 | 600,176 | $34,000 | 30.06% | $736,368 | |
| 1937 | 736,368 | $34,000 | -37.13% | $441,579 | |
| 1938 | 441,579 | $34,000 | 32.98% | $541,998 | |
| 1939 | 541,998 | $34,000 | -1.10% | $502,410 | |
| 1940 | 502,410 | $34,000 | -11.31% | $415,433 | |
| 1941 | 415,433 | $34,000 | -20.65% | $302,667 | |
| 1942 | 302,667 | $34,000 | 9.30% | $293,653 | |
| 1943 | 293,653 | $34,000 | 21.47% | $315,401 | |
| 1944 | 315,401 | $34,000 | 16.36% | $327,438 | |
| 1945 | 327,438 | $34,000 | 32.84% | $389,803 | |
| 1946 | 389,803 | $34,000 | -22.48% | $275,818 | |
| 1947 | 275,818 | $34,000 | -3.34% | $233,742 | |
| 1948 | 233,742 | $34,000 | 2.89% | $205,514 | |
| 1949 | 205,514 | $34,000 | 20.51% | $206,692 | |
| 1950 | 206,692 | $34,000 | 23.63% | $213,499 | |
| 1951 | 213,499 | $34,000 | 16.72% | $209,511 | |
| 1952 | 209,511 | $34,000 | 17.09% | $205,506 | |
| 1953 | 205,506 | $34,000 | -1.80% | $168,419 | |
| 1954 | 168,419 | $34,000 | 53.13% | $205,835 | |
| 1955 | 205,835 | $34,000 | 32.10% | $226,994 | |
| 1956 | 226,994 | $34,000 | 4.48% | $201,641 | |
| 1957 | 201,641 | $34,000 | -13.10% | $145,680 | |
| 1958 | 145,680 | $34,000 | 41.24% | $157,736 | |
| 1959 | 157,736 | $34,000 | 10.38% | $136,580 |
Bill ends up withdrawing $1,020,000 over 30 years, WHICH IS EXACTLY what he started with. When getting down to 3.5% or lower withdrawal rates, just putting the money in inflation protected government bonds would make more sense than investing in risk assets at all. This is because just keeping pace with inflation $1,000,000 is $33,0000 a year for 30 years with no returns at all.
Scenario 3: Bill grows a brain and reacts to reality! Rather than blindly withdrawing based on what his original balance was, Bill will take a withdrawal based on the remaining balance. He will take 5% of the remaining balance each year.
| inflation adj. | |||||
| balance | Withdrawal % | Withdrawal $ | real return | End Balance | |
| 1928 | 687333 | 0.00% | $0 | 45.49% | $1,000,001 |
| 1929 | 1,000,001 | 5.00% | $50,000 | -8.83% | $866,116 |
| 1930 | 866,116 | 5.00% | $43,306 | -20.01% | $658,166 |
| 1931 | 658,166 | 5.00% | $32,908 | -38.07% | $387,222 |
| 1932 | 387,222 | 5.00% | $19,361 | 1.82% | $374,556 |
| 1933 | 374,556 | 5.00% | $18,728 | 48.85% | $529,650 |
| 1934 | 529,650 | 5.00% | $26,483 | -2.66% | $489,783 |
| 1935 | 489,783 | 5.00% | $24,489 | 42.49% | $662,998 |
| 1936 | 662,998 | 5.00% | $33,150 | 30.06% | $819,180 |
| 1937 | 819,180 | 5.00% | $40,959 | -37.13% | $489,268 |
| 1938 | 489,268 | 5.00% | $24,463 | 32.98% | $618,097 |
| 1939 | 618,097 | 5.00% | $30,905 | -1.10% | $580,733 |
| 1940 | 580,733 | 5.00% | $29,037 | -11.31% | $489,299 |
| 1941 | 489,299 | 5.00% | $24,465 | -20.65% | $368,846 |
| 1942 | 368,846 | 5.00% | $18,442 | 9.30% | $382,991 |
| 1943 | 382,991 | 5.00% | $19,150 | 21.47% | $441,958 |
| 1944 | 441,958 | 5.00% | $22,098 | 16.36% | $488,550 |
| 1945 | 488,550 | 5.00% | $24,427 | 32.84% | $616,540 |
| 1946 | 616,540 | 5.00% | $30,827 | -22.48% | $454,045 |
| 1947 | 454,045 | 5.00% | $22,702 | -3.34% | $416,936 |
| 1948 | 416,936 | 5.00% | $20,847 | 2.89% | $407,536 |
| 1949 | 407,536 | 5.00% | $20,377 | 20.51% | $466,565 |
| 1950 | 466,565 | 5.00% | $23,328 | 23.63% | $547,974 |
| 1951 | 547,974 | 5.00% | $27,399 | 16.72% | $607,615 |
| 1952 | 607,615 | 5.00% | $30,381 | 17.09% | $675,884 |
| 1953 | 675,884 | 5.00% | $33,794 | -1.80% | $630,532 |
| 1954 | 630,532 | 5.00% | $31,527 | 53.13% | $917,257 |
| 1955 | 917,257 | 5.00% | $45,863 | 32.10% | $1,151,112 |
| 1956 | 1,151,112 | 5.00% | $57,556 | 4.48% | $1,142,548 |
| 1957 | 1,142,548 | 5.00% | $57,127 | -13.10% | $943,230 |
| 1958 | 943,230 | 5.00% | $47,162 | 41.24% | $1,265,608 |
| 1959 | 1,265,608 | 5.00% | $63,280 | 10.38% | $1,327,129 |
Bill still withdrew about the same total amount of money ($994,000), but instead of only having $136,000 at the end of 30 years, Bill had $1.3 Million. He had to tighten his belt in down years and had to spend several years with a budget of about half the $50,000 he started with. But what good is that $1.3 Million to Bill when he is 95? His life could have been improved greatly by spending more money while he was alive.
The proper response to series of return risk, which is based on hitting really bad returns the first few years of retirement, is to work a part time job during those down years to supplement those losses. Immediately stop the bleeding. It is also smart to increase withdrawals towards the end, when life expectancy is falling.
Scenario 4: Bill applies my test of reducing the percentage withdrawal following bad years and increasing it following good years. He gets a part time job 12 months into his retirement to replace income he expected from his portfolio. Between this income, some cash savings, Social Security, and renting out a spare bedroom in his house, Bill takes a 3% withdrawal in 1930, and a 2% withdrawal in 1931 and 1932. He then follows this chart for the first 15 years of his retirement:
- -50% to 0%: 3%
- 0% to 10%: 4%
- 10% to 15%: 5%
- 15% to 20%: 6%
- 20%+: 7%
At age 80, Bill’s expected life expectancy is 8 more years. Bill starts to withdrawal more money from his accounts. He doesn’t have to spend it, but he certainly can. Adjusted withdraw rates by age:
- 80 to 84: 10%
- 85 to 89: 12%
- 90+ 15%
| inflation adj. | ||||||
| age | balance | Withdrawal % | Withdrawal $ | real return | End Balance | |
| 65 | 1928 | 687333 | 0.00% | $0 | 45.49% | $1,000,001 |
| 66 | 1929 | 1,000,001 | 7.00% | $70,000 | -8.83% | $847,882 |
| 67 | 1930 | 847,882 | 3.00% | $25,436 | -20.01% | $657,874 |
| 68 | 1931 | 657,874 | 2.00% | $13,157 | -38.07% | $399,273 |
| 69 | 1932 | 399,273 | 2.00% | $7,985 | 1.82% | $398,409 |
| 70 | 1933 | 398,409 | 4.00% | $15,936 | 48.85% | $569,310 |
| 71 | 1934 | 569,310 | 7.00% | $39,852 | -2.66% | $515,375 |
| 72 | 1935 | 515,375 | 3.00% | $15,461 | 42.49% | $712,327 |
| 73 | 1936 | 712,327 | 7.00% | $49,863 | 30.06% | $861,601 |
| 74 | 1937 | 861,601 | 7.00% | $60,312 | -37.13% | $503,770 |
| 75 | 1938 | 503,770 | 2.00% | $10,075 | 32.98% | $656,516 |
| 76 | 1939 | 656,516 | 7.00% | $45,956 | -1.10% | $603,843 |
| 77 | 1940 | 603,843 | 3.00% | $18,115 | -11.31% | $519,482 |
| 78 | 1941 | 519,482 | 3.00% | $15,584 | -20.65% | $399,843 |
| 79 | 1942 | 399,843 | 2.00% | $7,997 | 9.30% | $428,288 |
| 80 | 1943 | 428,288 | 10.00% | $42,829 | 21.47% | $468,217 |
| 81 | 1944 | 468,217 | 10.00% | $46,822 | 16.36% | $490,335 |
| 82 | 1945 | 490,335 | 10.00% | $49,034 | 32.84% | $586,225 |
| 83 | 1946 | 586,225 | 10.00% | $58,623 | -22.48% | $408,998 |
| 84 | 1947 | 408,998 | 10.00% | $40,900 | -3.34% | $355,804 |
| 85 | 1948 | 355,804 | 12.00% | $42,696 | 2.89% | $322,156 |
| 86 | 1949 | 322,156 | 12.00% | $38,659 | 20.51% | $341,642 |
| 87 | 1950 | 341,642 | 12.00% | $40,997 | 23.63% | $371,688 |
| 88 | 1951 | 371,688 | 12.00% | $44,603 | 16.72% | $381,774 |
| 89 | 1952 | 381,774 | 12.00% | $45,813 | 17.09% | $393,377 |
| 90 | 1953 | 393,377 | 15.00% | $59,007 | -1.80% | $328,352 |
| 91 | 1954 | 328,352 | 15.00% | $49,253 | 53.13% | $427,384 |
| 92 | 1955 | 427,384 | 15.00% | $64,108 | 32.10% | $479,888 |
| 93 | 1956 | 479,888 | 15.00% | $71,983 | 4.48% | $426,179 |
| 94 | 1957 | 426,179 | 15.00% | $63,927 | -13.10% | $314,797 |
| 95 | 1958 | 314,797 | 15.00% | $47,220 | 41.24% | $377,927 |
| 96 | 1959 | 377,927 | 15.00% | $56,689 | 10.38% | $354,582 |
Bill withdrawals a total of $1.26 Million over his retirement and ends with $355,000, plenty for final expenses and leaving an inheritance to his grandchildren. That extra quarter million he withdrew during his life would have made a massive improvement in his standard of living compared to all other scenarios we ran.
Keep in mind, all of these scenarios are at the absolute worst possible time to retire. What if we used the same plan for the most recent 30 year period? A retirement that started in 1993 by Bill’s grandson using this same methodology would look like this:
| inflation adj. | ||||||
| age | balance | Withdrawal % | Withdrawal $ | real return | End Balance | |
| 65 | 1992 | 958000 | 0.00% | $0 | 4.40% | $1,000,152 |
| 66 | 1993 | 1,000,152 | 4.00% | $40,006 | 6.96% | $1,026,972 |
| 67 | 1994 | 1,026,972 | 4.00% | $41,079 | -1.24% | $973,668 |
| 68 | 1995 | 973,668 | 3.00% | $29,210 | 33.81% | $1,263,779 |
| 69 | 1996 | 1,263,779 | 7.00% | $88,465 | 18.67% | $1,394,746 |
| 70 | 1997 | 1,394,746 | 6.00% | $83,685 | 30.88% | $1,715,917 |
| 71 | 1998 | 1,715,917 | 7.00% | $120,114 | 26.31% | $2,015,659 |
| 72 | 1999 | 2,015,659 | 7.00% | $141,096 | 17.73% | $2,206,922 |
| 73 | 2000 | 2,206,922 | 6.00% | $132,415 | -12.05% | $1,824,529 |
| 74 | 2001 | 1,824,529 | 3.00% | $54,736 | -13.24% | $1,535,472 |
| 75 | 2002 | 1,535,472 | 3.00% | $46,064 | -23.85% | $1,134,184 |
| 76 | 2003 | 1,134,184 | 2.00% | $22,684 | 25.80% | $1,398,268 |
| 77 | 2004 | 1,398,268 | 7.00% | $97,879 | 7.16% | $1,393,497 |
| 78 | 2005 | 1,393,497 | 4.00% | $55,740 | 1.45% | $1,357,155 |
| 79 | 2006 | 1,357,155 | 4.00% | $54,286 | 12.77% | $1,469,245 |
| 80 | 2007 | 1,469,245 | 5.00% | $73,462 | 1.32% | $1,414,207 |
| 81 | 2008 | 1,414,207 | 10.00% | $141,421 | -36.54% | $807,710 |
| 82 | 2009 | 807,710 | 10.00% | $80,771 | 22.49% | $890,428 |
| 83 | 2010 | 890,428 | 10.00% | $89,043 | 13.19% | $907,088 |
| 84 | 2011 | 907,088 | 10.00% | $90,709 | -0.94% | $808,705 |
| 85 | 2012 | 808,705 | 12.00% | $97,045 | 13.89% | $810,510 |
| 86 | 2013 | 810,510 | 12.00% | $97,261 | 30.18% | $928,507 |
| 87 | 2014 | 928,507 | 12.00% | $111,421 | 12.79% | $921,592 |
| 88 | 2015 | 921,592 | 12.00% | $110,591 | 0.74% | $817,002 |
| 89 | 2016 | 817,002 | 12.00% | $98,040 | 9.53% | $787,479 |
| 90 | 2017 | 787,479 | 15.00% | $118,122 | 19.07% | $797,003 |
| 91 | 2018 | 797,003 | 15.00% | $119,551 | -6.11% | $636,061 |
| 92 | 2019 | 636,061 | 15.00% | $95,409 | 28.24% | $693,331 |
| 93 | 2020 | 693,331 | 15.00% | $104,000 | 16.48% | $686,454 |
| 94 | 2021 | 686,454 | 15.00% | $102,968 | 19.85% | $699,307 |
| 95 | 2022 | 699,307 | 15.00% | $104,896 | -23.00% | $457,697 |
| 96 | 2023 | 457,697 | 15.00% | $68,655 | 22.25% | $475,604 |
This 30 year retirement provided for a total of $2.7 million in withdrawals, an average of $90,000 per year, or 9% of the original starting balance on a per year basis, and it still left $475,000 at the end of 30 years. The only really bad year here was at age 76 in 2003 when he would have only withdrawn $22,000 following this plan. This was after 3 successive negative years and was followed up by a large year. Even if he was tempted in this year to withdrawal 4% and take out $45,000 he still would be successful and end this retirement with $465,000.
He also would have likely not needed to withdraw any money because of all the money he would have withdrawn in 1998 through 2000. During those 3 years he would have withdrawn almost $400,000. The cash from that likely would have been available to use during the low year of 2003.
Just for fun, the math for a retiree in 1993 following Dave’s advise would be successful with withdrawing a flat 8%, $80,000 per year, every year. The portfolio would have $113,000 left at the end, with total withdraws of $2.48 Million. This is $220,000 less than what was achieved with my methodology, and resulted in $360,000 less at the end of the period.
| inflation adj. | ||||||
| age | balance | Withdrawal % | Withdrawal $ | real return | End Balance | |
| 65 | 1992 | 958000 | 8.00% | 4.40% | $1,000,152 | |
| 66 | 1993 | 1,000,152 | 8.00% | $80,000 | 6.96% | $984,195 |
| 67 | 1994 | 984,195 | 8.00% | $80,000 | -1.24% | $892,983 |
| 68 | 1995 | 892,983 | 8.00% | $80,000 | 33.81% | $1,087,852 |
| 69 | 1996 | 1,087,852 | 8.00% | $80,000 | 18.67% | $1,196,018 |
| 70 | 1997 | 1,196,018 | 8.00% | $80,000 | 30.88% | $1,460,644 |
| 71 | 1998 | 1,460,644 | 8.00% | $80,000 | 26.31% | $1,743,892 |
| 72 | 1999 | 1,743,892 | 8.00% | $80,000 | 17.73% | $1,958,900 |
| 73 | 2000 | 1,958,900 | 8.00% | $80,000 | -12.05% | $1,652,492 |
| 74 | 2001 | 1,652,492 | 8.00% | $80,000 | -13.24% | $1,364,294 |
| 75 | 2002 | 1,364,294 | 8.00% | $80,000 | -23.85% | $977,990 |
| 76 | 2003 | 977,990 | 8.00% | $80,000 | 25.80% | $1,129,672 |
| 77 | 2004 | 1,129,672 | 8.00% | $80,000 | 7.16% | $1,124,828 |
| 78 | 2005 | 1,124,828 | 8.00% | $80,000 | 1.45% | $1,059,978 |
| 79 | 2006 | 1,059,978 | 8.00% | $80,000 | 12.77% | $1,105,121 |
| 80 | 2007 | 1,105,121 | 8.00% | $80,000 | 1.32% | $1,038,653 |
| 81 | 2008 | 1,038,653 | 8.00% | $80,000 | -36.54% | $608,361 |
| 82 | 2009 | 608,361 | 8.00% | $80,000 | 22.49% | $647,190 |
| 83 | 2010 | 647,190 | 8.00% | $80,000 | 13.19% | $642,002 |
| 84 | 2011 | 642,002 | 8.00% | $80,000 | -0.94% | $556,719 |
| 85 | 2012 | 556,719 | 8.00% | $80,000 | 13.89% | $542,935 |
| 86 | 2013 | 542,935 | 8.00% | $80,000 | 30.18% | $602,649 |
| 87 | 2014 | 602,649 | 8.00% | $80,000 | 12.79% | $589,496 |
| 88 | 2015 | 589,496 | 8.00% | $80,000 | 0.74% | $513,266 |
| 89 | 2016 | 513,266 | 8.00% | $80,000 | 9.53% | $474,557 |
| 90 | 2017 | 474,557 | 8.00% | $80,000 | 19.07% | $469,799 |
| 91 | 2018 | 469,799 | 8.00% | $80,000 | -6.11% | $365,982 |
| 92 | 2019 | 365,982 | 8.00% | $80,000 | 28.24% | $366,743 |
| 93 | 2020 | 366,743 | 8.00% | $80,000 | 16.48% | $333,998 |
| 94 | 2021 | 333,998 | 8.00% | $80,000 | 19.85% | $304,417 |
| 95 | 2022 | 304,417 | 8.00% | $80,000 | -23.00% | $172,801 |
| 96 | 2023 | 172,801 | 8.00% | $80,000 | 22.25% | $113,449 |
Focus on what we can control:
- We can’t blindly follow an arbitrary single sentence rule.
- Withdrawing less money when times are bad and more money when times are good makes a portfolio last longer.
- Withdrawing only based on the current balance of the portfolio and not what it was 5, 10 , 15 years ago makes a lot more sense than basing all withdrawals off of that initial amount.
- Increasing withdrawals towards the end of life in order to maximize utility of the money makes sense.
Develop A Need For Less Income:
A major goal to shoot for in retirement is to have a need for less total income. Most financial advisors recommend having 90% to 100% of your pre-retirement income in paper assets and to plan for a 4% withdrawal rate. This advice means that most people will never retire. This is because our earnings increase over time, and it takes 25 times our earnings to duplicate income following the 4% rule.
Image a scenario where Jim is 40 years old and earns $50,000 a year. The standard advice says that he needs $45,000 a year in retirement, so Jim must save $1,125,000 by the time his is 65. He adjusts his savings to make this happen.
But Jim get’s subsequent promotions at work. at 50 years old Jim is earning $70,000 a year, and at 60 Jim is earning $110,000 a year. Now following this advice Jim needs to have $2,750,000 to retire! But wait! The doom and gloom people on the news say we must use a 3% withdraw rule, meaning Jim actually needs to have $3,667,000 to retire! Our retirement income needs should be based on actual expenses, not on previous income.
In retirement our 6 major expenses should be greatly reduced or eliminated:
- Children: Kids should be grown, launched and self supporting.
- Housing: Average people spend at least 25% of their income on housing. With a paid off house this expense should drop to around 5% to cover maintenance and property taxes.
- Health Care: At 65 retirees are eligible for Medicare which costs about 75% less than plans on the open market. Reducing health insurance costs from around 10% to 2.5%.
- Retirement savings: Most people save around 15% for retirement. Being in retirement we are no longer saving for it.
- Vehicles: Most couples are dual income. In retirement they should be able to live just fine with 1 vehicle instead of 2 since no one needs to be at work. Paying off a newer car while still working ensures no car payments or car purchase expenses for at least the first decade of retirement. Most people spend around 12% of their income on vehicles. This can drop to under 3% with only needing to cover maintenance, insurance, and gas.
- Taxes: Income taxes can be much lower now because we don’t need to income to cover all the above expenses! People who saving in Roth accounts will also greatly benefit as they are tax free.
Rather than needing $110,000 a year, Jim can live a very comfortable lifestyle on $40,000 a year. He actually is running a large monthly surplus compared to when he was working! Jim gets $1,500 a month from Social Security, after adjusting for reduced benefits, so he only needs $22,000 a year in income from his retirement accounts. Using a 6% withdrawal rate (of the remaining balance each year) Jim would only need $367,000 saved, just 13% of the $2.75 million the experts recommend for a 4% rule.
| Working | Retired | ||
| Income | $110,000 | $40,000 | |
| Retirement Savings 15% | -$16,500 | $0 | Not saving for retirement |
| Income Taxes 20% | -$22,000 | $0 | Need a lower income. Stand. Ded |
| and Roth Accounts | |||
| House Pmt 25% | -$27,500 | -$5,500 | House paid off, only taxes, ins, maint. |
| Transportation 12% | -$13,200 | -$3,300 | cars paid off, only insurance, gas, and maint. |
| Groceries 12% | -$13,200 | -$9,900 | Reduce 25% more time to mealprep, no work lunches |
| Health Care 10% | -$11,000 | -$2,096 | Reduced thanks to Medicare, actual Part B cost |
| Utilities 3% | -$3,300 | -$3,300 | |
| Misc 3% | -$3,300 | -$3,300 | |
| Remaining | $0 | $12,604 |
Since Jim’s income needs are small he is also well insulated from rate of return risk. He can work part time for 20 bucks an hour 10 hours a week and earn $10,000 a year to offset bad years. He can also rent out a spare bedroom in his house for $500 a month for another $6,000 a year. In a bad year for the market Jim could get by with only withdrawing $6,000 instead of $22,000, greatly increasing the longevity of his portfolio.
Balancing Real Estate with Paper Assets:
The idea that our entire net worth should be in paper assets came from a desire to turn us all into wage slaves. Think about what we have been covering here:
- Workers must save for retirement through tax advantaged 401k plans that are tied to an employer.
- Workers need to save up at least 25 times their planned retirement income in these plans, but should strive for 33 times their planned retirement income.
- Workers must plan to have retirement income equal to at least 90% of their final pay. This changes the goal post as incomes increase.
All of these aspects put together mean that we must work essentially forever. Investing in the stock market has been a long term proven solution to building wealth, but should not be the only aspect of our retirement income.
In addition to paying off major expenses, like our homes and vehicles, we also should diversify our retirement savings to not be 100% reliant on paper assets. I highly recommend everyone buy at least 1 piece of real estate as a part of their retirement portfolio. This can be a traditional home, a multifamily home, storage units, or other commercial real estate. The idea is the property generates a positive cash flow and is paid off on a 15 year loan by the time we decide to retire.
A major advantage to real estate is that the owner has some control over it. We can give it new paint and flooring to make it more appealing to tenants. We can add a garage and a 2nd bathroom to increase the rent. We may be able to turn a 4 bedroom 2 bath house into 2 2 bedroom 1 bath apartments. We may be able to rent the house out short term for higher profits. We might be able to add a pole barn to the property and rent it out. There is a level of control that doesn’t exist with paper assets.
Real Estate can be leveraged: If I have $1 million of cash in retirement accounts I can only exchange it for $1 million worth of stocks and bonds. If I have $1 million of cash in hand, I can exchange it for $4 million of real estate. Controlling $4 million of real estate can certainly provide a higher income than $1 million of stocks, even after paying the mortgages.
As an example, we will use a $100,000 home that rents out for $1,500 a month today. Buying it on a 15 year mortgage 15 years prior to desired retirement date. In 15 years the property will be paid off, and the rents should double in that 15 year time frame. The down payment will be recouped in 54 months from positive cash flow and the property will generate $2,200 a month in positive cash flow in retirement, covering over 50% of the desired retirement budget.
| Year 1 | Year 16 | ||
| Pre Retirement | At Retirement | ||
| Purchase Price | $100,000.00 | $100,000.00 | |
| Down Payment | $20,000.00 | $20,000.00 | |
| Current Value | $100,000.00 | $250,000.00 | |
| 15 Year 7% Mortgage | $80,000.00 | ||
| Rent | $1,500.00 | $3,000.00 | |
| Interest Payment | -$467.00 | 0 | |
| Maintenance | -75 | -70 | |
| Property Management | -150 | -280 | |
| Insurance | -65 | -130 | |
| Taxes | -125 | -250 | |
| Depreciation | -272.72 | -272.72 | (Assume 10K land cost) |
| Net Income | $345.27 | $1,997.27 | |
| Principal Payment | -252 | ||
| Net Cash | $366.00 | $2,270.00 | |
| Repay Down Payment | 54 months |
This is not an extreme situation. This property could be ran as an Airbnb for the first 5 years and likely pay itself off in that time frame. Continuing to run it as a short term rental would likely result in closer to $4,000 of income per month from that one property. The owner has control over real estate, but does not have control over the stock market.
What if my numbers are wrong and the house only rents for $1,100 a month now, and only increases to $2,000 a month by retirement with a value of $175,000? It is still a great investment. It is just barely cash flow positive at first, but when paid off it still provides $1,800 a month in positive cash flow or $21,600 a year. One would need $540,000 in retirement accounts at a 4% withdrawal to match that income!
Bottom Line:
The 4% Rule, The 3% Rule, The 8% Rule, and any other rule that can be summed up in 3 words is absolutely the wrong approach to retirement planning. We have to use our brains and react to reality when we are in retirement. We need to build multiple sources of income, not just paper assets in a retirement account. We need to strive to maximize our Social Security benefits and be willing to live on less, take on room mates, and go back to work part time if we find ourselves in a great depression scenario.
Leave a Reply