The Housing Affordability Crisis Is Here To Stay
Housing to purchase and to rent has increased dramatically over the last few years, and this is a major problem for the US. So what happened? How did housing become so expensive in such a short period of time? Primarily we didn’t build enough housing for decades, we built the wrong housing, we tear down housing, and we have fewer people living in each housing unit. There are actions we can take to work our way out of this, but it will take several years of focused effort.
We Haven’t Built Enough Houses In The Last 4 Decades:
Not Enough Total Housing Units Have Been Built:
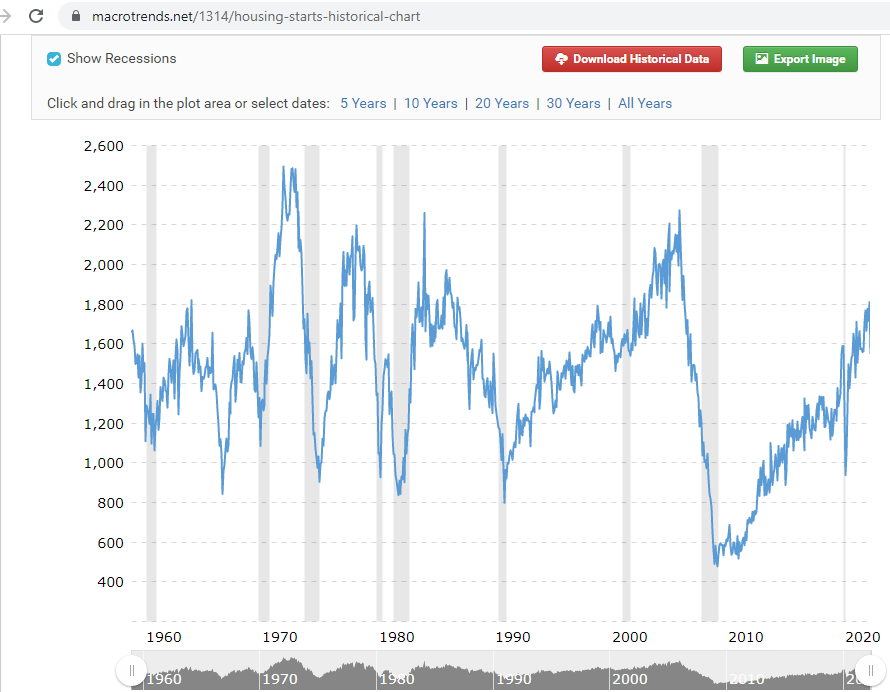
We had a massive valley in home builds from 1984 to 2006, and the peak just reached in 2006 was just starting to get back to the early 1980s levels and then the great recession hit. Home building stopped dead in its tracks. The home building industry has yet to recover. Look at this chart for new housing starts going back to the 60s,
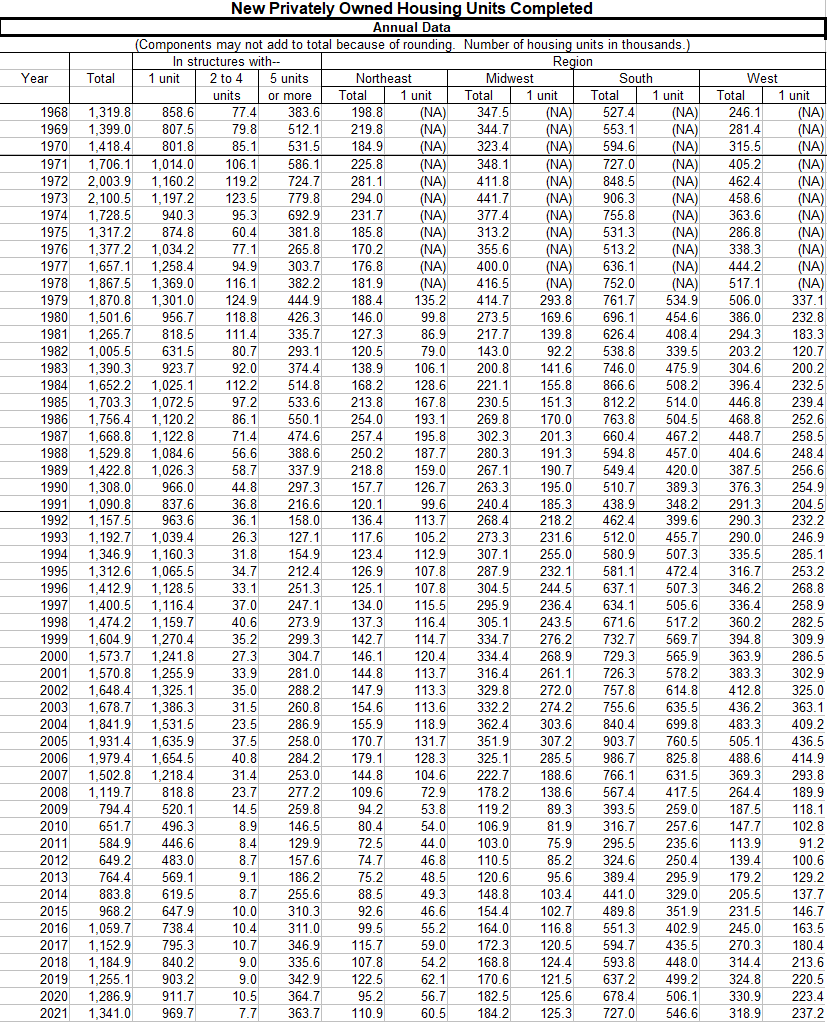
And here’s a table of new housing completes from 1968 onward:
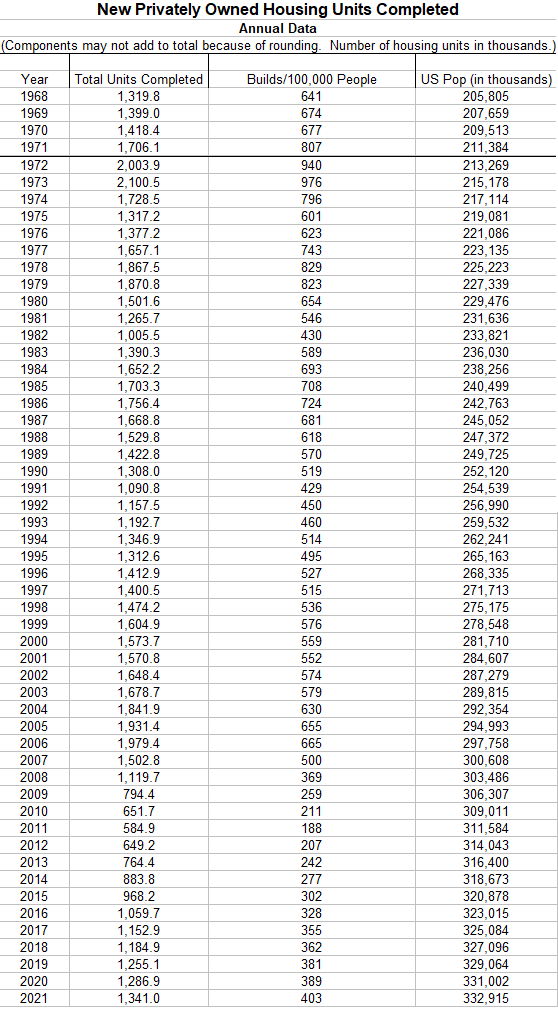
Now let’s factor in population changes. Here’s the chart focusing on builds per 100,000 people.
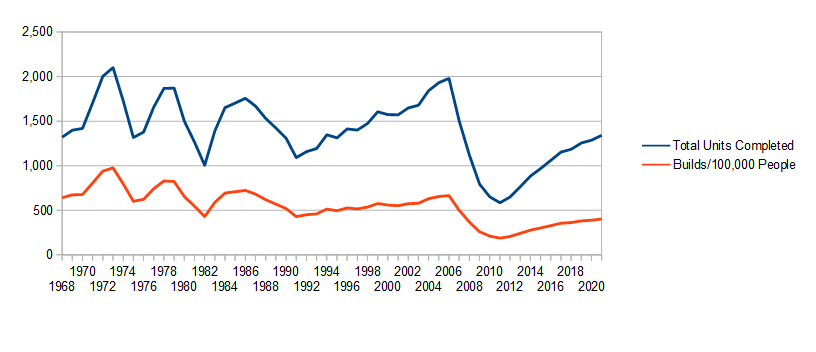
Here it is in graph form. Note that we fell below 500 builds per 100,000 people in 2007 and still have yet to recover.
We Are Building The Wrong Houses:
When houses are being built they are typically high end houses, or highly specific custom houses. The average home built in 2022 is 2,491 sq. ft, the average home built in 1950 was 983 square feet. Looking beyond just the total square footage, modern houses are also designed extremely inefficiently. The roof layout always comes to my mind when looking at these houses. You rarely see 2 straight lines for a roof line anymore. Rather than being built to economize on scale, homes today are mostly individually built and take several months, which of course increases costs.
In many municipalities it is illegal to construct small homes. Even in my extremely rural township of under 2,000 people it is illegal to build a single family home of under 1,000 square feet. A reminder that in 1950 the average home was under 1,000 square feet and many functional homes were built with a total square footage of 500 to 1,000 sq. ft. A very basic 25 X 25 house can provide 2 bedrooms of 10 X 10 and a 10 X 9 with a bathroom in between them of 6 X 10 and a living room and kitchen each with 12 X 15 feet of space. A minimum requirement of 1,000 square feet is ridiculous and is just 1 common restriction. In my township even multifamily homes can not exceed 2.5 stories….oh, and looking at the zoning map there are exactly ZERO lots in the entire township zoned for multifamily housing.
Look at Levittown for building efficiency. The original Levittown houses were 700 square feet in size and a new house was completed every 16 minutes at peak production. The houses were effectively built like an assembly line with each crew moving from lot to lot to lot doing the exact same job. A house properly scheduled could be built in a single day. A new house in 1951 was sold for $7,990 (only to WWII vets who were white, but that’s another story.) $7,990 in 1951 is the equivalent of roughly $89,000 in 2022. Over 17,000 houses were built in this single neighborhood in 6 years!
local government artificial ordinances are absolutely preventing affordable housing. This is a massive problem. Many areas are zoned “SFH”, not allowing MFH, not allowing mobile home parks. If each lot could have a 4 plex instead of a single family house, then there would be more unit available. If zoning would allow larger apartment complexes of several stories then population density would increase and there would be a greater supply in high demand areas like Silicon Valley.
What I found really interesting when looking at the data of housing builds since 1968 was that 2 to 4 unit construction fell off a cliff in 1984 and has almost completely disappeared. 4 unit construction is extremely efficient in terms of cost and in terms of financing options available. (4 units qualify for 3.5% down payment FHA loans). With a 4 unit building the square footage per unit is often around 600 to 800 square feet, with a total building square footage of around 2,400 to 3,200 square feet. The 6 unit property I recently purchased was most likely originally a 4 unit with around 2,800 square feet total. For the cost to build a slightly bigger than average single family home, you get 4 units. One foundation, one roof, one furnace. Yes, there are four bathrooms, but compared to the other savings the cost per unit is much lower than SFH.
If we had kept building 2 to 4 unit properties at the rate we were in 1984, then we would have 4 million more lower cost units today.

Building has become more expensive:
The following costs have caused new home construction to increase substantially over the last few decades:
- Government regulations: NIMBY, building codes, local regulations like minimum sq. footages and all SFH zoning.
- building materials: Increased costs for lumber, copper, roofing, flooring, etc.
- labor costs: Aging workforce and 4 decades of pushing all kids to go to college resulted in a massive undersupply of construction workers, when a supply is low, the cost will go up.
- consumer expectations: Consumers want 2 to 4 bathrooms, 2,500 sq. ft, attached garages, large picture windows, and the list goes on. The median house built today would look like a mansion in 1940s and 1950s America.
- better margins on high end homes: Builders earn more money on higher end homes and apartments.
We Are Demolishing Houses:
Rather than allow housing to be fixed up they get destroyed. The new housing builds need to of course outnumber the homes being demolished, and we need to subtract the amount demolished in order to know the net increase in total housing units over time. I have not found any detailed statistics on this, however I have found rough estimates of 300,000 to 400,00 homes per year annually. Just in my small city of Benton Harbor, MI with a population of 10,000 people in the last 15 years we have seen a trailer park shut down, eminent domain take hundreds of homes for an airport expansion, and hundreds of homes destroyed through the tax foreclosure process that were labelled as blight.
Mobile Home Parks: This is another “NIMBY” issue (Not In My Backyard) where local municipalities refuse to allow new mobile home parks to be made, and often declare war on existing mobile home parks. These nimby regulations are why so few parks have been built in the last 30 years and why mobile home parks become such an attractive investment. After condemning a mobile home park Benton Township refused to let other developers buy it to return it to a mobile home park and a decade later rezoned it to single family housing, despite admitting that many people were interested in returning it to a mobile home park.
Tax Foreclosures: Michigan used to allow the county governments to keep any additional money they got from auctioning off property for taxes that were behind 3 years or more. My county ran an extensive blight reduction program with this money and would select homes that they would schedule for demolition, rather than allow the market to decide its value and investors to attempt to bring them back to life. Now that the Michigan Supreme Court struck this down, the county doesn’t have money for this program anymore.
Eminent Domain: For the airport expansion plan in my small town (which was expanded due to mandates post 9/11), over 250 homes were destroyed, and not just any homes, but low cost housing. The neighborhoods destroyed were mostly small 2/1 and 3/1 houses built in the 1940s and 1950s. These homes were on average worth around $30,000 to $60,000. The Supreme court decision held in Keto that if a new project would yield more tax revenue it was “for the public good” and local government could seize homes to turn into parking lots, commercial developments, or anything else. Some states have passed laws preventing this, however eminent domain is a strong source of removal of housing units from the market.
Demand For Housing Has Accelerated:
An Increasing Population and an Aging Population:
The total population has increased from 151 million people in 1950 to 334 million people today. That’s a 221% increase. The total population of the US has been increasing, so it makes sense for housing demand to increase as well. An aging population also means that the increase in population isn’t evenly distributed. in 1950 for example 58.4% of the population was over 25, in 2020 68.7% of the population is over 25.
151 million people in 1950 @ 58.4% adult population = 88.2 million people over 25
IF the population distribution stayed static until now then the following math would be accurate,
334 million people in 2020 @ 58.4% adult population = 195 million people over 25
This is growth of 107 million adults since 1950!
However, since the demographics have changed we now have 229.5 million people over 25 instead of 195 million.
334 million people in 2020 @ 68.7% adult population = 229.5 million people over 25
Applying these numbers to the populations at the time and we are talking about 34.5 million more adults than there would be with the population distribution being stabilized. This is a major change!
The Number of People Per Household:
Another demand factor to look at is the number of people per household. This is a key metric to look at in the conversation of a housing shortage. In 1950 it was 3.5, today it is 2.5. This tells an interesting story.
All things being equal in 1950 for the 151 million people we would need 43 million housing units. If the numbers stayed the same with todays population we would need 95.4 million houses for 334 million people, however since the average household size dropped to 2.5 we need 133.6 million housing units. That’s an increase of 38 million housing units needed SOLELY from the decrease in household size.
What drives down the average household size? Reduction in children being born, delayed/prevented marriages, increased divorce rate, children moving out earlier, and elderly living by themselves.
In 1950 the average woman married at age 20 and the average man at age 23. Today the average age for marriage is 27 for women and 29 for men. This is 7 years longer than in 1950. That means for 7 years it is more likely that these people are living by themselves in households of 1, whereas in 1950 they would be sharing the same living space. Divorce was also less common, so later in life there are far more single people as well.
Another factor driving down household size is the number of people who choose to live alone outside of the marriage statistics above. It is less common for people to get roommates today than it was 40 years ago, despite housing being substantially more expensive. Look at “The Golden Girls” as an example.
My great grandmother lives alone in a 3 bedroom house, my grandmother lives alone in a 3 bedroom house. My mother in law lives alone in a 3 bedroom house. My father in law lives alone in a 2 bedroom house. My wife’s grandfather lives alone in a 3 bedroom house. It’s OK for people to live alone, but if market forces make it a struggle, it should make sense for people to share housing. Any of these people could easily add 1 to 2 people living with them and greatly reduce their housing costs, while making more housing units available to the market. The Golden Girls show was an excellent example, they lived a much better lifestyle because they were all sharing the same housing costs.
A third of adults over 65 live alone today in the US. In 1950 only 10% of those over 65 lived alone. Today 16.9% of the population is over 65 Vs 8.1% of the population in 1950. In 1950 there were 13 million adults over 65, with 10% living alone this was 1.3 million people. Today there are 54.1 million people over 65, with 33% living alone this is 17.8 million people! This is over 13 times the amount of elderly living alone our country had in 1950.
Corporate Buying:
This is a new phenomenon where corporations are buying thousands of single family homes to use as short term vacation rentals. In addition to using them as short term rentals, another major reason for corporate buying is as an inflation hedge. They are typically buying in fast growing cities like Nashville, Austin, and Atlanta.
As a direct result of our government printing trillions of dollars, investors want to move their money into safe, inflation resistant investments, and single family housing is a strong resistor to inflation, especially single family houses in rapidly growing cities. Couple this with the fact that these large investment firms can secure loans at far better terms than individuals can, and you have hundreds of thousands of homes being locked up from the principal residence market and often from the long term rental market as well.
Typical loans for the large investment firms are at 1.5% Yes you read that right 1.5%. Because they can get the money cheaper they can bid higher on these houses that owner occupants who have to pay 4% to 6%.
We Are Looking To Buy In The Wrong Places:
With the advent of remote work following Covid 19 location has become less of a burden in choosing where we live. Often people choose where they live based on their job and/or kids school. With virtual schooling and home schooling options exploding in popularity in addition to the remote work options, more Americans can choose to live anywhere, and if they choose small towns in the the Midwest, they can not only find houses, but not even have to enter a bidding war to get them!
Demand is location dependent. Demand for housing in San Jose, CA is much higher than Kokomo, IN. In Kokomo IN, even in today’s market you can often snag a 4 bedroom move in ready house for under $75,000, while you would be hard pressed to find a 4 bedroom for under $1 million, and realistically even $1.5 million in San Jose.
The national market is made up of thousands of local markets, and there are many local markets that have not seen the nationwide price hikes that get reported on constantly.
Won’t Increased Interest Rates Lower Prices?
Maybe increased interest rates will cause prices to lower in some markets. The interest rate spike of mortgage rates doubling in 6 months has been a major change to the market and home sales have slowed, while inventory is starting to build up. The current median home sale price is at $407,000. Assuming a 3.5% down payment we are looking at a mortgage of $392,755.
At the current 6% interest rate on a 30 year mortgage this house has a monthly payment of $2,355
At the January interest rate of 3% on a 30 year mortgage this house has a payment of $1,656.
The cost of money increasing doesn’t necessarily mean that prices will drop, and certainly not enough to offset the increased cost of the interest. That $407,000 house is not going to drop to $290,000. What’s more is that increased interest rates, especially paired with the increased costs of labor and building materials, will greatly impact new construction. With fewer homes built the supply constraint will stay in place and there will continue to be a shortage of housing units.
OK So What Can We Do?
We can sit around and complain that the baby boomer generation destroyed the housing market for us, and we wouldn’t be wrong, but what good would that do? In order to drive down the costs of housing we have to take action.
- Fight local zoning regulations: Baby boomers are leaving these positions of local power and/or can be defeated in these positions of power. Join township and city boards to change the local zoning regulations that prevent small houses, tiny houses, multi-family housing, accessory dwelling units, and mobile home parks from being built.
- Don’t Be A NIMBY. Don’t oppose new housing developments of any kind. Loudly support any new development. Usually those in support are quiet while those in opposition are loud and ultimately get what they want.
- Be open to moving to lower cost areas while working remotely. The explosion in remote work opportunities is the best thing to come from COVID. If enough people leave “high demand” areas for low demand areas, the prices nationwide will drop.
- Build housing! Look into finding a way to build new, rather than buy existing. When building don’t customize every single aspect, go for efficiency of cost and construction.
- Tell your government to stop printing money, which is causing runaway inflation. Don’t vote for big government. The size and scale of our current federal government needs to be cut in half to stave off inflation. If you vote for anyone who voted for a $2 trillion spending bill, you voted for inflation and an increase of costs.
- Consider living in a denser housing unit. Either rent out a room or 2 to someone or move grandma or grandpa in with you to save everyone money and reduce total housing demand. Don’t kick your kid out at 18 or high school graduation. Let them live at home for a few more years.
What do you think about the current housing affordability crisis? How many people live in your household? Currently there are 6 in mine. We have varied from a low of 3 to a high of 10.
Leave a Reply