Why Don’t Kids Move Out At 18 Anymore?
A friend of mine recently posted a meme that was in the form of the question, asking “Why don’t kids move out at 18 anymore?” I thought this was an interesting question to explore. Let’s get into finding out how people have moved out across time and what has led to changes over time. Culturally there is this lingering expectation/social norm that it was common and expected for 18 year olds to leave the house once they graduated high school.
How Many People Historically Moved Out At 18?
First we need to examine our premise to ensure we are comparing apples to apples. At what rate did 18 year olds move out of the house across time? Unfortunately data is not separated to just 18 year olds, but it is separated to the category of 18-24 year olds. When looking at this data it is also logical to conclude that the older end of this bracket skews the data upwards, meaning that a 24 year old is significantly more likely to live alone than an 18 year old.
Here is the data ranging from 1967 to 2023 from the US Censure Bureau (Table AD-3 18-24):
| Table AD-3. Living Arrangements of Adults 18 to 24 Years Old, 1967 to 2023 | ||||||||||||||||
| Total number (in thousands) | Percent | |||||||||||||||
| 18 to 24 years old | Total | Living alone | Living with spouse1 | Child of householder2 | Living with partner3 | Living with other relatives | Living with nonrelatives | |||||||||
| Year | Men | Women | Men | Women | Men | Women | Men | Women | Men | Women | Men | Women | Men | Women | Men | Women |
| 2023 | 15,477 | 14,965 | 100.0 | 100.0 | 5.6 | 4.3 | 4.4 | 7.8 | 57.7 | 54.1 | 8.4 | 11.7 | 15.5 | 13.9 | 8.4 | 8.2 |
| 2022 | 14,556 | 14,405 | 100.0 | 100.0 | 5.7 | 4.5 | 4.9 | 7.7 | 55.8 | 53.6 | 9.1 | 13.0 | 15.1 | 13.9 | 9.4 | 7.2 |
| 2021r | 14,656 | 14,413 | 100.0 | 100.0 | 4.8 | 4.6 | 4.2 | 7.3 | 59.5 | 54.7 | 6.9 | 11.6 | 14.1 | 13.3 | 10.5 | 8.4 |
| 2021 | 14,543 | 14,293 | 100.0 | 100.0 | 4.8 | 4.6 | 4.3 | 7.4 | 59.2 | 54.5 | 7.0 | 11.7 | 14.1 | 13.3 | 10.6 | 8.5 |
| 2020 | 14,633 | 14,418 | 100.0 | 100.0 | 4.8 | 4.5 | 4.2 | 8.0 | 59.3 | 55.6 | 7.1 | 9.8 | 15.6 | 13.7 | 8.9 | 8.4 |
| 2019 | 14,605 | 14,478 | 100.0 | 100.0 | 5.5 | 5.5 | 5.5 | 9.0 | 55.6 | 52.2 | 6.8 | 10.7 | 15.4 | 14.4 | 11.3 | 8.2 |
| 2018 | 14,838 | 14,510 | 100.0 | 100.0 | 5.0 | 5.4 | 5.6 | 9.1 | 56.9 | 51.1 | 7.7 | 11.2 | 13.5 | 14.2 | 11.3 | 8.9 |
| 2017 | 14,777 | 14,488 | 100.0 | 100.0 | 5.2 | 4.9 | 6.0 | 9.7 | 57.0 | 51.0 | 7.3 | 10.2 | 14.4 | 14.7 | 10.2 | 9.5 |
| 2016 | 15,023 | 14,646 | 100.0 | 100.0 | 5.3 | 5.1 | 5.1 | 9.1 | 58.3 | 51.4 | 7.2 | 10.8 | 13.9 | 14.5 | 10.3 | 9.0 |
| 2015 | 15,123 | 14,893 | 100.0 | 100.0 | 4.6 | 4.8 | 5.4 | 9.4 | 57.6 | 50.9 | 7.7 | 12.4 | 14.3 | 15.2 | 10.5 | 7.2 |
| 2014s | 15,280 | 14,852 | 100.0 | 100.0 | 4.9 | 5.5 | 5.8 | 10.6 | 57.3 | 50.6 | 7.5 | 11.4 | 14.7 | 14.5 | 9.7 | 7.5 |
| 2013 | 15,137 | 14,867 | 100.0 | 100.0 | 5.0 | 5.3 | 6.0 | 10.0 | 57.7 | 51.1 | 7.9 | 11.7 | 13.6 | 14.2 | 9.8 | 7.7 |
| 2012 | 15,154 | 14,971 | 100.0 | 100.0 | 4.3 | 4.8 | 6.1 | 10.6 | 59.4 | 50.9 | 7.6 | 11.8 | 12.9 | 14.7 | 9.6 | 7.1 |
| 2011 | 14,978 | 14,820 | 100.0 | 100.0 | 4.9 | 4.8 | 6.2 | 11.4 | 57.6 | 49.2 | 8.2 | 11.9 | 13.7 | 14.5 | 9.4 | 8.1 |
| 2010 | 14,824 | 14,469 | 100.0 | 100.0 | 4.9 | 4.4 | 6.7 | 12.5 | 56.2 | 47.9 | 7.7 | 12.4 | 13.8 | 14.3 | 10.8 | 8.5 |
| 2009 | 14,498 | 14,161 | 100.0 | 100.0 | 6.0 | 4.7 | 7.4 | 13.4 | 55.6 | 48.0 | 7.6 | 11.3 | 12.9 | 14.4 | 10.5 | 8.2 |
| 2008 | 14,377 | 13,983 | 100.0 | 100.0 | 5.9 | 5.8 | 7.4 | 13.2 | 55.1 | 47.4 | 8.3 | 13.0 | 12.7 | 13.4 | 10.6 | 7.2 |
| 2007 | 14,409 | 13,976 | 100.0 | 100.0 | 5.5 | 5.7 | 7.6 | 15.0 | 53.7 | 46.5 | 8.8 | 12.4 | 13.3 | 13.2 | 11.0 | 7.2 |
| 2006 | 14,101 | 13,841 | 100.0 | 100.0 | 5.9 | 5.5 | 8.3 | 15.8 | 53.4 | 46.3 | 6.0 | 8.9 | 13.9 | 14.4 | 12.5 | 9.1 |
| 2005 | 14,060 | 13,933 | 100.0 | 100.0 | 5.4 | 5.5 | 8.7 | 15.7 | 52.6 | 45.5 | 5.9 | 8.9 | 13.5 | 14.7 | 13.9 | 9.7 |
| 2004 | 14,165 | 13,611 | 100.0 | 100.0 | 5.4 | 5.6 | 8.6 | 16.0 | 56.0 | 45.7 | 5.2 | 8.3 | 12.9 | 14.3 | 12.0 | 10.1 |
| 2003 | 13,812 | 13,592 | 100.0 | 100.0 | 5.2 | 6.0 | 8.8 | 16.1 | 54.8 | 45.7 | 5.5 | 8.3 | 13.5 | 14.2 | 12.2 | 9.8 |
| 2002 | 13,695 | 13,602 | 100.0 | 100.0 | 4.3 | 5.0 | 9.3 | 16.9 | 55.0 | 45.5 | 5.0 | 7.4 | 13.7 | 14.6 | 12.7 | 10.6 |
| 2001 | 13,412 | 13,361 | 100.0 | 100.0 | 5.2 | 5.4 | 9.5 | 18.2 | 54.7 | 44.8 | 5.1 | 7.6 | 12.4 | 14.5 | 13.1 | 9.4 |
| 2000 | 13,250 | 13,207 | 100.0 | 100.0 | 4.2 | 4.4 | 9.8 | 17.7 | 56.8 | 46.7 | 4.5 | 7.0 | 11.7 | 14.0 | 12.9 | 10.2 |
| 1999 | 12,902 | 12,993 | 100.0 | 100.0 | 5.0 | 5.1 | 10.4 | 17.7 | 57.3 | 48.6 | 4.0 | 6.1 | 11.0 | 14.1 | 12.4 | 8.5 |
| 1998 | 12,613 | 12,546 | 100.0 | 100.0 | 5.6 | 4.2 | 9.8 | 18.4 | 58.4 | 47.0 | 3.8 | 5.5 | 10.8 | 13.6 | 11.5 | 11.2 |
| 1997 | 12,502 | 12,405 | 100.0 | 100.0 | 4.5 | 4.2 | 10.0 | 18.7 | 59.7 | 47.8 | 3.9 | 6.1 | 10.4 | 14.3 | 11.5 | 8.9 |
| 1996 | 12,378 | 12,409 | 100.0 | 100.0 | 4.6 | 4.0 | 11.9 | 19.5 | 58.6 | 47.4 | 3.6 | 6.0 | 10.0 | 13.2 | 11.3 | 9.9 |
| 1995 | 12,545 | 12,612 | 100.0 | 100.0 | 5.0 | 4.7 | 12.5 | 21.5 | 57.9 | 46.0 | 5.0 | 6.8 | 8.9 | 13.8 | 10.6 | 7.2 |
| 1994 | 12,683 | 12,792 | 100.0 | 100.0 | 4.6 | 4.4 | 12.7 | 22.3 | 58.9 | 45.6 | 5.2 | 6.7 | 9.3 | 14.1 | 9.2 | 6.9 |
| 1993 | 12,857 | 12,860 | 100.0 | 100.0 | 5.4 | 4.4 | 12.8 | 23.0 | 55.9 | 43.9 | 5.2 | 6.7 | 11.5 | 14.9 | 9.2 | 7.1 |
| 1992 | 12,083 | 12,353 | 100.0 | 100.0 | 5.1 | 4.6 | 12.9 | 23.2 | 56.7 | 44.7 | 4.9 | 6.5 | 11.0 | 14.4 | 9.4 | 6.6 |
| 1991 | 12,275 | 12,627 | 100.0 | 100.0 | 5.2 | 4.1 | 13.6 | 23.8 | 56.4 | 45.6 | 4.0 | 5.7 | 11.3 | 14.0 | 9.5 | 6.8 |
| 1990 | 12,450 | 12,860 | 100.0 | 100.0 | 5.5 | 4.3 | 13.8 | 24.5 | 55.3 | 44.9 | 4.1 | 5.6 | 11.5 | 13.4 | 9.8 | 7.3 |
| 1989 | 12,574 | 13,054 | 100.0 | 100.0 | 5.9 | 4.5 | 15.0 | 25.1 | 55.1 | 44.6 | 4.5 | 6.1 | 10.6 | 12.9 | 8.9 | 6.8 |
| 1988 | 12,823 | 13,230 | 100.0 | 100.0 | 5.3 | 4.5 | 14.6 | 25.5 | 57.9 | 46.4 | 3.8 | 5.0 | 9.4 | 11.7 | 8.9 | 6.8 |
| 1987 | 13,029 | 13,433 | 100.0 | 100.0 | 5.3 | 4.6 | 14.6 | 26.5 | 60.6 | 47.0 | 3.5 | 4.7 | 7.3 | 11.0 | 8.7 | 6.2 |
| 1986 | 13,324 | 13,788 | 100.0 | 100.0 | 5.7 | 4.8 | 16.6 | 28.6 | 58.2 | 46.1 | 2.9 | 4.8 | 7.7 | 9.9 | 8.9 | 5.8 |
| 1985 | 13,696 | 14,149 | 100.0 | 100.0 | 5.6 | 4.1 | 16.2 | 28.3 | 59.2 | 47.1 | 2.6 | 3.9 | 7.2 | 10.0 | 9.3 | 6.6 |
| 1984 | 14,006 | 14,439 | 100.0 | 100.0 | 5.0 | 4.3 | 16.9 | 29.2 | 61.0 | 46.6 | 2.5 | 3.8 | 6.7 | 10.3 | 7.8 | 5.8 |
| 1983 | 14,344 | 14,702 | 100.0 | 100.0 | 4.8 | 4.4 | 17.8 | 29.9 | 60.8 | 46.9 | 2.6 | 4.0 | 6.6 | 9.4 | 7.4 | 5.4 |
| 1982 | 14,368 | 14,815 | 100.0 | 100.0 | 5.9 | 4.6 | 19.0 | 31.7 | 58.3 | 45.0 | 2.8 | 4.2 | 6.6 | 9.2 | 7.5 | 5.3 |
| 1981 | 14,367 | 14,848 | 100.0 | 100.0 | 6.4 | 5.1 | 20.1 | 32.8 | 57.0 | 43.4 | 2.7 | 4.1 | 5.8 | 9.2 | 8.0 | 5.3 |
| 1980 | 14,303 | 14,815 | 100.0 | 100.0 | 6.8 | 5.3 | 21.1 | 34.2 | 55.4 | 43.2 | 2.3 | 3.6 | 5.9 | 8.5 | 8.5 | 5.3 |
| 1979 | 13,730 | 14,320 | 100.0 | 100.0 | 6.4 | 5.5 | 21.6 | 34.6 | 56.0 | 42.7 | 2.4 | 3.3 | 5.4 | 7.7 | 8.2 | 6.2 |
| 1978 | 13,542 | 14,169 | 100.0 | 100.0 | 6.6 | 5.5 | 22.7 | 35.8 | 56.3 | 41.9 | 1.7 | 2.8 | 5.7 | 8.8 | 7.1 | 5.2 |
| 1977 | 13,410 | 13,994 | 100.0 | 100.0 | 5.8 | 4.6 | 24.1 | 38.0 | 56.5 | 41.7 | 1.6 | 2.4 | 4.9 | 8.2 | 7.1 | 5.1 |
| 1976 | 13,156 | 13,780 | 100.0 | 100.0 | 5.3 | 4.3 | 25.5 | 39.5 | 56.9 | 40.9 | 1.3 | 2.1 | 4.4 | 8.5 | 6.5 | 4.7 |
| 1975 | 12,836 | 13,484 | 100.0 | 100.0 | 5.0 | 3.9 | 27.7 | 41.6 | 55.1 | 40.9 | 0.9 | 1.3 | 4.9 | 8.2 | 6.4 | 4.0 |
| 1974 | 12,322 | 13,191 | 100.0 | 100.0 | 4.6 | 4.2 | 29.6 | 43.4 | 53.7 | 39.1 | 0.9 | 1.2 | 4.7 | 7.4 | 6.5 | 4.7 |
| 1973 | 12,180 | 12,992 | 100.0 | 100.0 | 3.9 | 3.4 | 30.0 | 44.1 | 54.3 | 38.8 | 0.6 | 0.7 | 7.3 | 10.0 | 4.0 | 3.1 |
| 1972 | 11,877 | 12,775 | 100.0 | 100.0 | 3.7 | 3.0 | 29.8 | 44.9 | 55.2 | 39.9 | 0.6 | 0.6 | 6.6 | 8.6 | 4.2 | 3.0 |
| 1971 | 11,172 | 12,384 | 100.0 | 100.0 | 2.8 | 3.0 | 30.7 | 44.9 | 56.2 | 39.9 | 0.4 | 0.4 | 6.2 | 8.5 | 3.7 | 3.3 |
| 1970 | 10,455 | 12,021 | 100.0 | 100.0 | 2.7 | 3.0 | 31.2 | 45.6 | 56.9 | 40.8 | 0.4 | 0.3 | 5.8 | 7.5 | 3.0 | 2.8 |
| 1969 | 9,842 | 11,482 | 100.0 | 100.0 | 2.9 | 2.7 | 31.5 | 45.8 | 56.8 | 40.9 | 0.2 | 0.2 | 5.5 | 7.3 | 3.2 | 3.0 |
| 1968 | 9,475 | 11,130 | 100.0 | 100.0 | 2.6 | 2.4 | 31.6 | 45.7 | 57.6 | 40.8 | 0.2 | 0.1 | 5.5 | 7.3 | 2.4 | 3.7 |
| 1967 | 9,228 | 10,803 | 100.0 | 100.0 | 2.1 | 2.1 | 31.2 | 46.3 | 58.0 | 41.9 | 0.1 | Z | 6.0 | 6.8 | 2.6 | 2.9 |
| Source: U.S. Census Bureau, Current Population Survey, Annual Social and Economic Supplement, 1967 to 2023. | ||||||||||||||||
Note: The numbers of “living with a spouse” over “Child of householder” can also be misleading. In this study if a couple is married this supersedes living with a parent, so if they are married and live with either spouses parents, then they are counted as living with spouse instead of child of householder. This over represents the percentage of young adults living on their own.
Wow! This is some amazing information that really challenges the idea that most people moved out at 18. The data doesn’t lie. This never happened. So what demographic changes did happen?
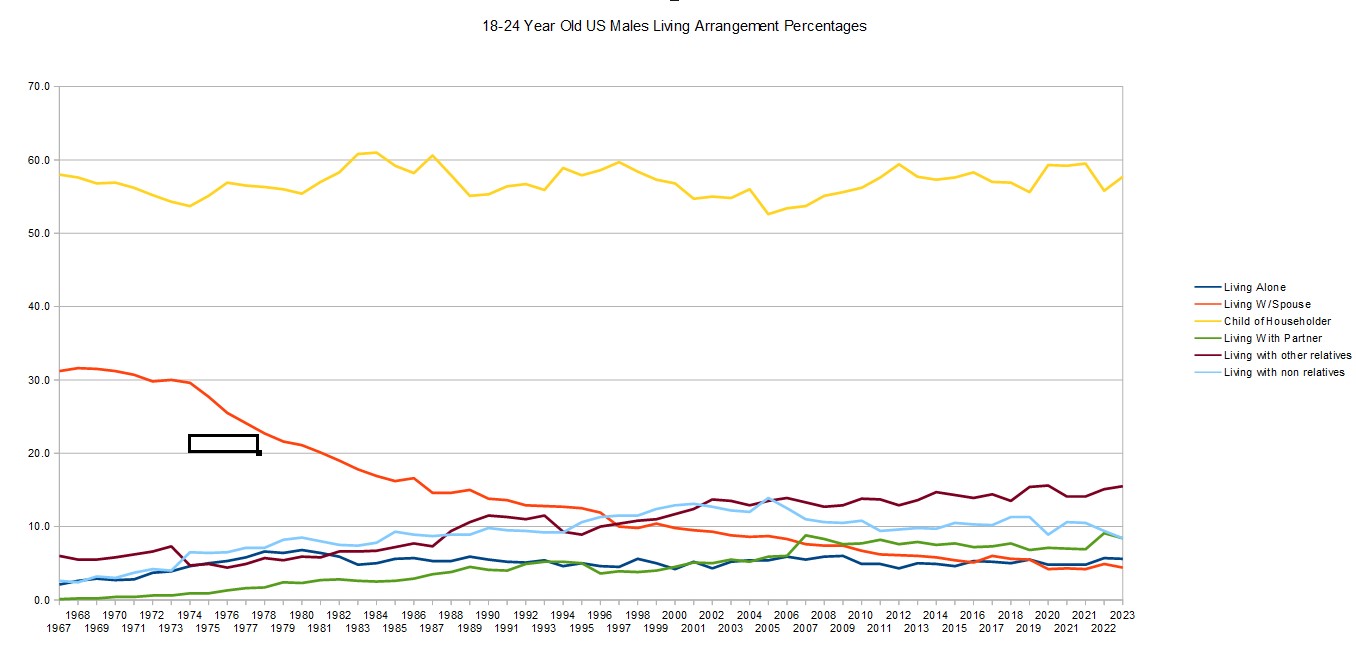
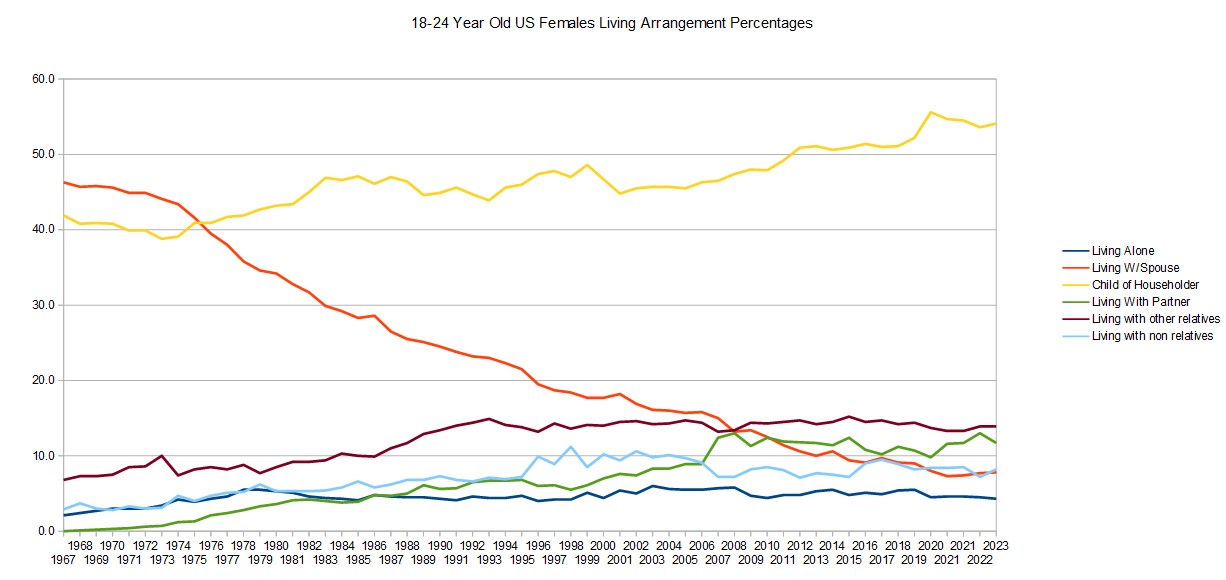
In 1967 58% of men 18-24 lived with their parents. In 2023 it was 57.7%. This percentage was almost the same in 2023. In 1967 41.9% of women 18-24 lived with their parents, In 2023 it was 54.1%, this is a 13% increase.
The largest change is the amount of young people living with a spouse. For men it was 31.2% in 1967 and for women it was 46.3%. In 2023 it is 4.4% for men and 7.8% for Women. This shows that people historically were married and combined had their own household earlier. This also shows that Women in general were marrying older men, which explains the 15% discrepancy between men living with a spouse and women living with a spouse in 1967.
The highest amount of 18-24 year olds living alone was 6.8% in 1980 for Men and 6% for Women in 2003. 2023’s numbers are lower, but not by a massive amount, with 5.6% for men and 4.3% for women. It was never the norm for an 18 year old to move out into their own apartment. Prior to the early 1970s it was extraordinarily uncommon, with just over 2% living alone then.
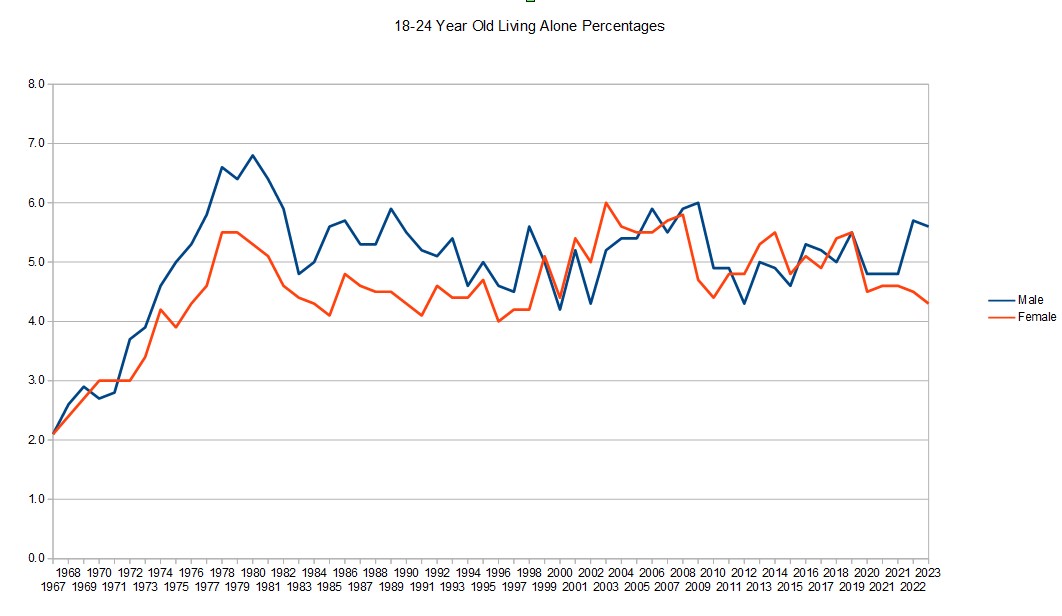
This chart above shows the maximum of people 18-24 living alone at just under 7%. For both men and women it has stayed in the 4% to 6% range between 1980 and today. The major change was the increase from 1967 to 1977 where it went from roughly 2% to 6.5% during that 10 year span. This was driven by several factors: low unemployment, high GDP output, an increase in lower cost housing stock, largely due to large apartment complex builds and mobile home communities, and shifting cultural norms of delayed marriage. This was the front end of the Baby Boom generation. Even with all of these factors the peak of 18-24 year olds living alone has never hit double digits.
It has always been cost prohibitive for people to live alone. People living alone also puts a massive strain on the overall housing supply by driving down the number of people per housing unit. The US has a rough population of 350 million people. If the average density per housing unit is 3 people, then the US needs 116 million housing units. If the average density is 2 then the US needs 175 million homes.
Delay And Decline Of Marriage:
The institution of marriage is the largest factor of household change since the 1960s. The cliff notes are:
- Increased women attending college
- Increased women entering the workforce for careers vs. part time supplemental income
- Increased cost to family formation
- Government financial incentives to not get married
- Reduced social stigma around remaining single
- Reduced social stigma around living with partner while not being married.
- Decreased benefit of marriage for men
- Increased cultural likelihood for divorce
When we look at the earlier charts we see this massive decline in young married couples. To some extent it has been replaced with cohabitating unmarried couples, which was virtually non existent in the late 60s. We also see a large increase in young people living with room mates and with other relatives besides their parents. The institution of marriage allowed for a stronger foundation for young people to launch. Generally speaking a married couple is far more committed than a couple who is dating. Buying a home, and even signing a year lease works much better when 2 incomes are involved and both people have reasonable assurance the other one isn’t leaving at the first sign of stress. There is much more risk to cohabitation with a boyfriend/girlfriend than to getting an apartment with a spouse. There are several other factors as to why fewer young people feel they can live on their own, or even with a significant other:
Fewer job opportunities: Automation, Retirement age people still working, child labor laws, high minimum wages, competition with sports, more time consuming video games are all factors that keep younger people from being able to get an apartment.
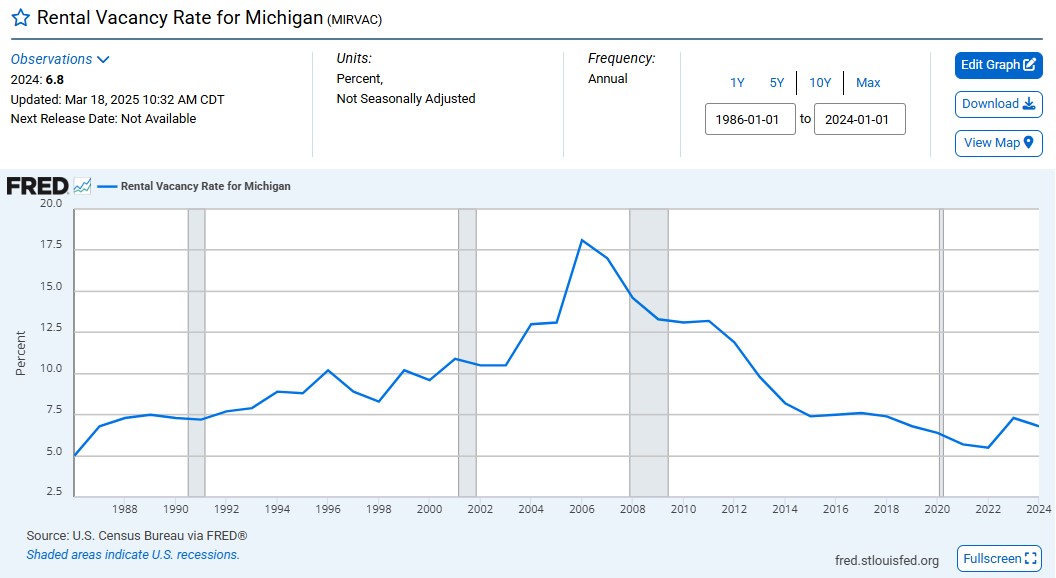
Fewer Apartments available: Housing units being constructed fell off a cliff with the 2008 recession. Since then new construction has had a larger focus on single family homes than on small multifamily. We also need to factor in immigration both legal and illegal over the last 15 years, which has been higher than historic norms. We have more people without building more housing. The net result is this chart, showing the change in rental vacancies over time. The most important section is the trend for the last 20 years.
Lower Likelihood of Approval: With fewer units there is competition for each unit, and 18 year olds don’t compete well. Very few will have a year+ of steady employment and virtually none will have a credit score of over 700. Most won’t have a credit score at all. Over the last 25 years it has become increasingly more common for apartment owners to use the credit score as a part of rental criteria.
Going back to availability of units, The current vacancy rate at 5.5% compared to 18% in 2006 may not seem like much, but it is massive. At 5.5% vacancy only units that were just emptied are vacant. This is roughly 1 out of 18 units. This is a tight market. When vacancies are at 10% there are move in ready apartments collecting cobwebs while landlords are desperate for tenants. A desperate landlord will rent to just about anyone with a pulse and a few hundred bucks. The apartments still have property taxes, utilities, and a mortgage coming out. The landlords expenses don’t vary by much if the apartment is occupied or unoccupied. When vacancies are high, 18 year olds can get apartments much easier. Mrs. C. and I got our first apartment together in 2005, about the peak of this graph. In Benton Harbor vacancy rates were likely higher than the state average. We went to one apartment complex and not only were we approved we were able to move in that week. They always had units available. I had under a year of job history and no credit. Mrs. C. had some bad credit items and a low credit score, but we had no problem getting a place. We both worked minimum wage jobs that were considered part time. Right now the only apartment complex in Benton Harbor that lists their units, Briarwood has only 1 2 bedroom apartment available and no 1 bedroom units. That 2 bedroom unit is $1,100!
Over the last several years there has emerged a new outlet for landlords if they do struggle to fill a unit, and that is to become a hotel. Short term rentals provide an alternative for landlords, which can squeeze the available supply of rental homes more. It is unlikely we will see another period of time where rental vacancies are in the double digits.
Is Moving Out At 18 (Or 18-24) Bad For Society?
I advocate for young adults to have amassed $85,000 before they move out. This encourages young adults to stay at home longer. What I don’t encourage is young adults to live at home and do nothing. It is insulting to the parents if the adult children are living at home as if they are 15 year old’s while either not working or working and doing nothing to prepare for their next phase in life.
It does our children, and society no favors to have them move out as young adults with little to no resources. It further increases the strain on the housing supply, and it ensures that our kids will be effectively living hand to mouth for many years, instead of building capital. Leaving home a few years later with an emergency fund, a reliable car, and $64,000 in retirement accounts puts young adults a decade into their economic future. These young adults who live at home longer will therefore be able to take more risks with their careers, start more businesses, and overall be better citizens because they will not be living in scarcity mode.
Young adult children living at home does not mean something is wrong with them and it is also not normal by any historical or cultural standard in the world for young adults to move out and live on their own. Even in the 1960s – 1980s when the US had one of the strongest economies ever in the history of the world greater than 50% of young adults 18-24 still lived with their parents.
When do you think an appropriate time to move out is? Is it based on age or should it be based more on milestones?
Leave a Reply