The Decline of Benton Harbor Charter Schools
The last month I have been taking a deep dive into Benton Harbor Area Schools and have been critical of several aspects of the district. Given the large property tax bills I (and everyone else in the district) pay, I am more concerned about their operations than that of a Charter School. Charter schools still receive taxpayer dollars from the state, but it doesn’t hurt as much given the dilution across the entirety of the state. Regardless, it is still taxpayer dollars and we should still be paying attention to it. Benton Harbor Charter is having some serious struggles due to quickly declining enrollment and may be in danger of shutting down in the next two years. Benton Harbor Charter is a for-profit Charter School owned by Choice Schools Associates
Enrollment:
I discussed how Benton Harbor Area Schools (BHAS) has had consistent declines in enrollment since 1967. Benton Harbor Charter (BHC) has now had consistent declines for just two years, but the decline is fast. For the 2025-26 school year enrollment is down 20%. A 20% drop in enrollment is catastrophic for any school, but especially for a small charter school. Traditional school districts have the stability of the property tax money coming in regardless of student count, charter schools do not. Across 2 years Benton Harbor Charter is down 27%.
Benton Harbor Area Schools has never seen a 20% drop, or even a 15% drop. This is really bad for Benton Harbor Charter School. Benton Harbor Charter lost 37 students in 2024 and 86 students in 2025. The largest single year drop Benton Harbor has on record is 1981 with a 10.4% drop, which was due to the desegregation lawsuit which led to BHAS sending several hundred students to Coloma and Eau Claire.
What’s more alarming with Benton Harbor Charter is the grade drops. When I compare enrollment by grade I look at the number of students in the same cohort who were in the previous grade last year, so I am comparing the same group of kids. If there were 60 first graders last year, then the goal would be to retain all of them to be 60 second graders this year.
The largest drop for a grade was 7th grade. This group saw a reduction of 38%, dropping from 47 sixth graders last year to 29 this year. 39% is wild. 3rd graders were at 37%, and Eighth graders were at 33%. Every single grade across the board had double digit declines. 16 of the students lost can be attributed to a larger class of Eighth graders who aged out to seventh graders last year.
| Benton Harbor Charter Enrollment By Grade | |||||||||
| Grade | 2019 | 2020 | 2021 | 2022 | 2023 | 2024 | 2025 | Cohort decline 24 to 25 | Percentage |
| K | 74 | 59 | 79 | 68 | 68 | 66 | 57 | -9 | -13.64% |
| 1 | 72 | 58 | 59 | 73 | 66 | 60 | 54 | -12 | -18.18% |
| 2 | 61 | 62 | 60 | 45 | 62 | 52 | 48 | -12 | -20.00% |
| 3 | 72 | 59 | 62 | 51 | 47 | 48 | 33 | -19 | -36.54% |
| 4 | 51 | 64 | 49 | 56 | 48 | 41 | 40 | -8 | -16.67% |
| 5 | 50 | 44 | 56 | 43 | 52 | 34 | 28 | -13 | -31.71% |
| 6 | 39 | 40 | 37 | 48 | 37 | 47 | 25 | -9 | -26.47% |
| 7 | 47 | 38 | 31 | 36 | 43 | 27 | 29 | -18 | -38.30% |
| 8 | 20 | 37 | 34 | 22 | 32 | 43 | 18 | -9 | -33.33% |
| Total | 486 | 461 | 467 | 442 | 455 | 418 | 332 | ||
Note: The math for the Kindergarten decline used the previous years Kindergarten numbers instead of a preschool number.
Seeing a decline in the Kindergarten numbers is surprising, since in 2021 Benton Harbor Charter started a free preschool program for 3 year olds. BHC should be seeing dividends from that in the Kindergarten numbers, yet there is a decline. Interestingly enough BHAS is also seeing a large decline in its Kindergarten class this year.
Michigan funding per pupil is $10,050. Combining the last 2 years, BHC has had an enrollment decline of 123 students, which would represent $1.2 million in funding. The other issue here that I think will add to the financial difficulty is the actual class sizes. In general I think 20 students per class is generally a target for most schools. When the numbers are close to this, it works, but currently most grades have gaps, which require an extra teacher. For larger districts any extra kids can get spread out and we have class sizes of 21-24. But when the school is already very small and only has 2 or 3 teachers per grade, they can’t split that many extra kids between 2 teachers effectively.
If the goal is 20 students per teacher, with an upper limit of 25, then:
- K: 57: 3 teachers – 3 capacity
- 1: 54: 3 teachers – 6 capacity
- 2: 48: 2 teachers +4 capacity each
- 3: 33: 2 teachers – 7 capacity
- 4: 40: 2 teachers – At capacity
- 5: 28: 2 teachers – 12 capacity
- 6: 25: 1 teacher +5 capacity
- 7: 29: 2 teachers – 11 capacity
- 8: 18: 1 teacher -2 capacity
The school has a net capacity for 32 more students with the same amount of teachers it currently must have. From their website Benton Harbor Charter appears to be combining some grades to address this challenge. As an example they have 3 teachers who are combined 4/5 grade.
Looking at further back data we can compare how each cohort of students has been reduced over time.
| BENTON HARBOR CHARTER | |||||||||||
| 2015 | 2016 | 2017 | 2018 | 2019 | 2020 | 2021 | 2022 | 2023 | 2024 | 2025 | |
| K | 61 | 79 | 75 | 85 | 74 | 59 | 79 | 68 | 68 | 66 | 57 |
| 1 | 68 | 75 | 82 | 80 | 72 | 58 | 59 | 73 | 66 | 60 | 54 |
| 2 | 75 | 68 | 74 | 76 | 61 | 62 | 60 | 45 | 62 | 52 | 48 |
| 3 | 51 | 52 | 61 | 69 | 72 | 59 | 62 | 51 | 47 | 48 | 33 |
| 4 | 54 | 44 | 45 | 56 | 51 | 64 | 49 | 56 | 48 | 41 | 40 |
| 5 | 38 | 48 | 46 | 51 | 50 | 44 | 56 | 43 | 52 | 34 | 28 |
| 6 | 40 | 21 | 30 | 49 | 39 | 40 | 37 | 48 | 37 | 47 | 25 |
| 7 | 22 | 26 | 22 | 28 | 47 | 38 | 31 | 36 | 43 | 27 | 29 |
| 8 | 20 | 25 | 21 | 26 | 20 | 37 | 34 | 22 | 32 | 43 | 18 |
| Total | 429 | 438 | 456 | 520 | 486 | 461 | 467 | 442 | 455 | 418 | 332 |
Following the Kindergarten class of:
- 2017: 75 Kindergarten to 18 8th graders: 76% reduction over 8 years
- 2018: 85 Kindergarten to 29 7th graders: 66% reduction over 7 years
- 2019: 74 Kindergarten to 25 6th graders: 66% reduction over 6 years
- 2020: 59 Kindergarten to 28 5th graders: 53% reduction over 5 years
- 2021: 79 Kindergarten to 40 4th graders: 49% reduction over 4 years
- 2022: 68 Kindergarten to 33 3rd graders: 51% reduction over 3 years
- 2023: 68 Kindergarten to 48 2nd graders: 29% reduction over 2 years
- 2024: 66 Kindergarten to 54 1st graders: 18% reduction over 1 year
This is terrible customer retention. Ideally a school would keep all the kids from 1 year to the next. If they come up short, each year they would try to fill in with transfer students, leading to very little change over the long term. The goal should be to acquire the kids in preschool/Kindergarten and then retain throughout with small infill adjustments for the few who leave. These consistent massive drops are completely unsustainable.
For comparison, here is the trend for BHAS:
- 2017: 118 Kindergarten to 73 8th graders: 38% reduction over 8 years
- 2018: 133 Kindergarten to 94 7th graders: 29% reduction over 7 years
- 2019: 127 Kindergarten to 90 6th graders: 29% reduction over 6 years
- 2020: 56 Kindergarten to 76 5th graders: 35% increase over 5 years
- 2021: 101 Kindergarten to 89 4th graders: 12% reduction over 4 years
- 2022: 100 Kindergarten to 70 3rd graders: 30% reduction over 3 years
- 2023: 86 Kindergarten to 74 2nd graders: 14% reduction over 2 years
- 2024: 80 Kindergarten to 89 1st graders: 11% increase over 1 year
The parents who left are not going to come back and it is difficult to get the remaining parents to transfer in. The parents of children at every school besides BHAS can reasonably say looking at their stats that their current school is a better school. This leaves only the parents of current BHAS students. It’s a very small market that Benton Harbor Charter has to appeal to.
What Happened? Why Did So Many Leave?
Some of this may be intentional. This is an excerpt from Benton Harbor Charter’s most recent audit:
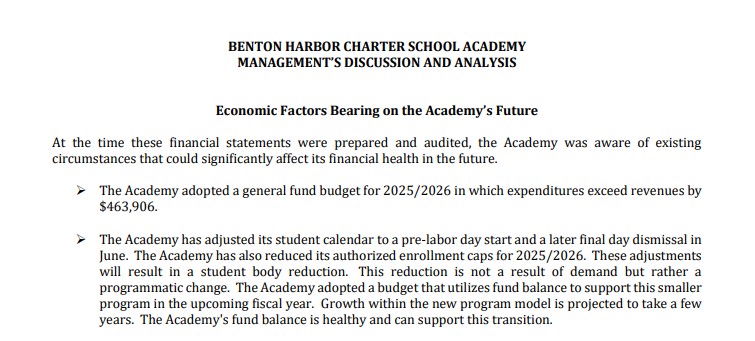
This does not say how much of a reduction they were shooting for or why they would choose to do this. They may have been shooting for a 5% to 10% reduction and far more decided to leave.
With some further digging I found the school board meeting minutes from May of 2025, which included these numbers, I put the actuals for 2025-26 in parenthesis
- K – 70 (57) down 13
- 1st – 70 (54) down 16
- 2nd – 50 (48) down 2
- 3rd – 50 (33) down 27
- 4th – 45 (40) down 5
- 5th – 30 (28) down 2
- 6th – 27 (25) down 2
- 7th – 28 (29) up 1
- 8th – 14 (18) up 4
- Total – 384 (332) down 52
If we attribute the reduction from 418 to 384 to the school and the reduction from 384 to 332 to demand we have 34 fewer students due to the school and an additional 52 due to the demand reduction.
Why would a school intentionally cut the amount of students they have when most of their funding is on a per pupil basis? My best guess is that the older end of children, those in grades 4 and up had more discipline issues and learning issues than those who are younger. This is likely due to the failed COVID response of the country and specifically our State. We shutdown school longer and entertained virtual school longer than most states. Michigan was the most draconian state with the exception of New York and California. We failed these kids and I suspect BHC doesn’t want the headaches from them. They want to fill their upper grades with students who have attended school regularly from Pre-school. The cut the higher grades then will add spots back to them each year as the current younger kids with more students per grade age.
On the demand side we will look at the regular stats that are typically used to evaluate school districts.
Test Scores:
Student performance on standardized tests is in line with BHAS at roughly <5% of students proficient in all subjects. This is certainly a category where some parents may decide to find another school for their children based off of. Is the standardized testing concept flawed? Absolutely. But the metric still will affect the decisions that parents make. As George W. Bush would ask “Is our children learning?”
- English: 7% Vs 46% state average
- Math <5% Vs 34% state average
- Science <5% Vs. 39% state average
- Social Studies <5% Vs. 39% state average
Suspensions/Expulsions:
For the 2024-25 school year BHC had 176 suspensions/expulsions compared to 27 for the state average. I’m almost doubtful that this could be real. 176 suspensions with 418 students all being K-8 is wild. I checked the school board minutes and found reference to 11 total kids being expelled for the year, so the rest of these must be suspensions.
For comparison, Eau Claire’s K-8 population is 372, fairly similar and they had 4 total suspensions or expulsions last year.
If these stats are accurate I could see parents of students who were suspended deciding to take their children elsewhere upon believing that either the bar for suspension is very low or that their child was being singled out.
Parents of children who were not suspended may feel their children are not safe there if so many kids exhibit behavior that requires suspension.
Attendance:
244 students were classified as Chronically absent, covering 57.6% of the students. Overall attendance rate of 82.69% This could be due to several factors on either the ends of the parents or the school.
Ratios:
- Students to Instructional staff: 17:1 the same as the state average
- Teacher years of experience: 2 years vs. state average of 12 years.
- Qualified teaching staff: 37% for BHC Vs. 92% state average.
Perhaps some parents decided that the inexperience level of their teachers was a red flag and wanted to take their kids elsewhere due to that.
Early Release Fridays:
Every Friday all students are released at 1PM. No other nearby school does this. This can be great if you have weekend plans, but for parents who work this can cause additional challenges similar to those caused by other districts that do a routine “late start” day. The early release Fridays appear to have started in the 2021-22 school year.
In addition to the scheduling inconvenience for a school where test scores are very low, cutting 2 hours per day every week works out to 72 hours of lost instructional time.
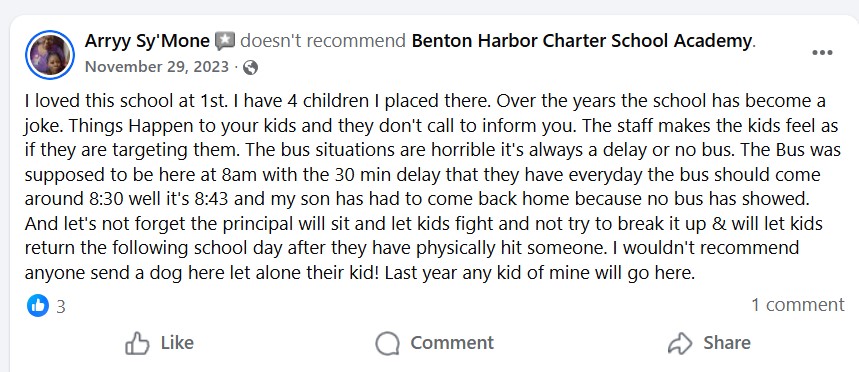
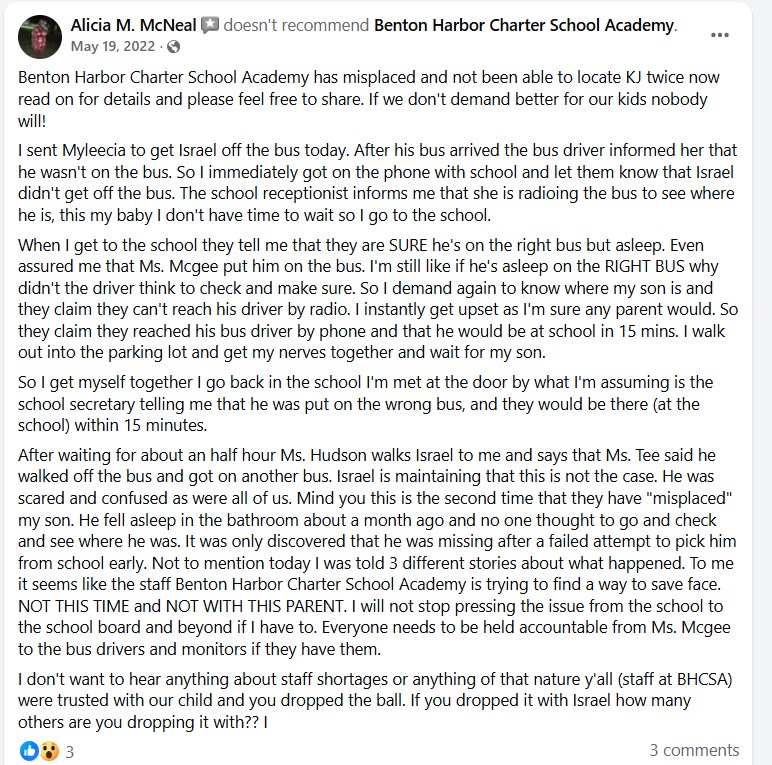
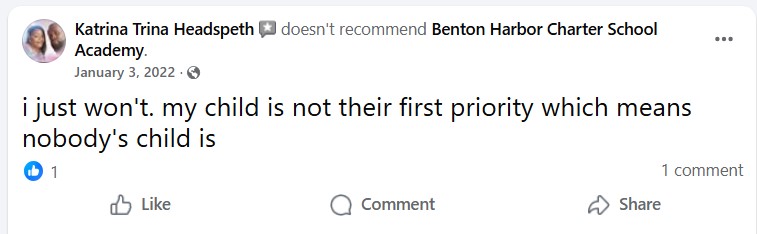
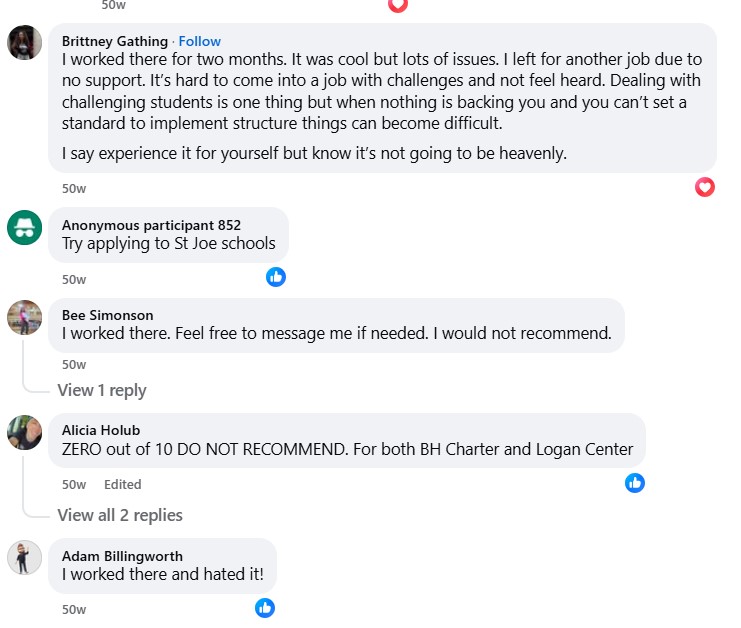
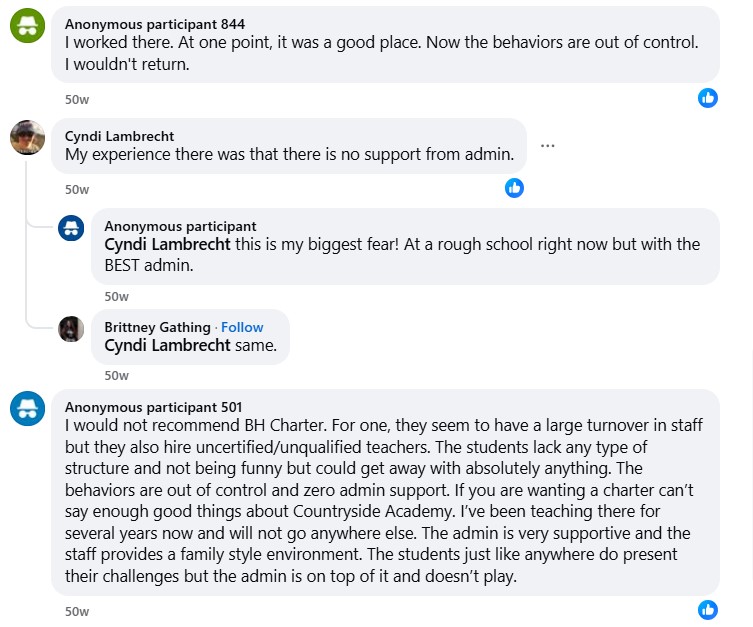
Reviews:
Now let’s look at some recent reviews. These are screenshots from the 3 most recent reviews published on Benton Harbor Charter’s Facebook page. I will say to take this with a grain of salt because people who have a bad experience are far more likely to post a review than people who have a good experience:
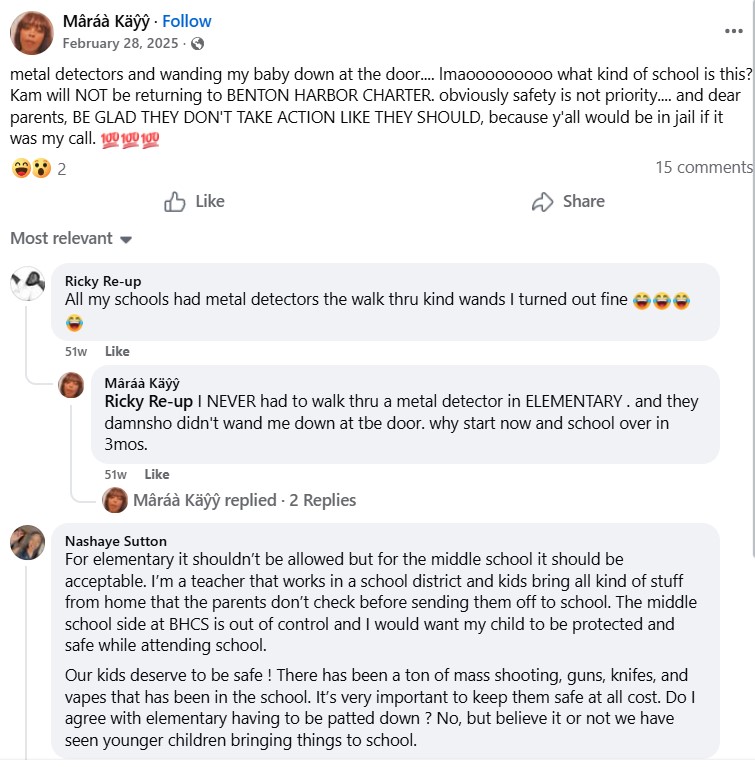
Now for some regular FB posts:

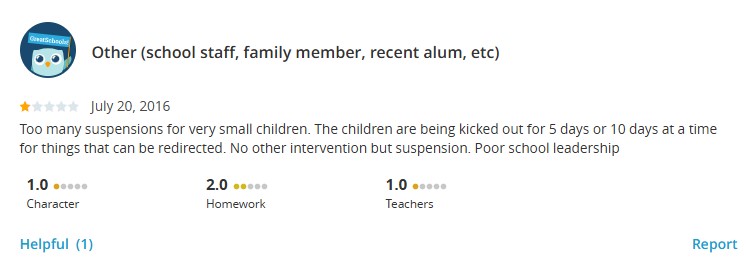
The most recent review on greatschools.org unfortunately is almost a decade old.
Could some of these issues be drivers for enough parents to pull their kids?
- Suspensions for very young children over perceived minor issues
- Kids unaccounted for on busses
- Bus delays/not showing up
- Lack of consistency / support between teachers and admin
Where Did The Kids Go?
Benton Harbor Charter only serves students up to Eighth grade. In 2024 they had 43 Eighth graders and 27 seventh graders. Since the Eighth graders had to move on to another school the school lost them and they were replaced with the smaller class. This accounts for a drop of 16 students that was already baked into their expectations. On the opposite end the district had 9 fewer Kindergarten students than the previous year. BHAS, Benton Harbor Charter, and Countryside all have a lower Kindergarten enrollment this year than last year.
The rest is in the middle, those who were in Kindergarten through seventh in the 2024-25 school year.
Many of the kids from Benton Harbor Charter ended up at Benton Harbor Area Schools. Among grades they usually see declines in BHAS had several grades increase in student number that were the same grades BHC lost students in. Taking the group of kids who were K-7 in 2024-25 and comparing to 1st through 8th in 2025-26: BHAS gained 37 students. In the same group BHC lost 100 students. In the previous year BHAS had a net loss of 22 students for these grades. If we assume they would have lost the same amount without the exodus from BHC, then there could be as many as 59 of the 100 students who left Benton Harbor Charter that are now at Benton Harbor Area Schools.
Countryside did not see substantial gains in these grades, so I have to assume that most of these remaining students were able to get school of choice slots in other districts. The data concerning the 2025-26 school of choice enrollees has not been published yet. Mildred C Wells gained 5 1st graders, 2 2nd graders, and 1 3rd grader.
One mystery I haven’t been able to figure out is where the 2nd graders from 2024-25 went. Looking at 3rd graders for 2025-26: Benton Harbor Charter is down 19, Benton Harbor is down 7, Countryside is down 5. I have not found a district in our area that has seen a substantial increase. The only thing I can think of is if a local private school added a class of 3rd graders and heavily advertised in the Benton Harbor Area. If you are a parent of a 3rd grade student in the area who switched schools, where did you switch your child to?
Will More Leave Next Year?
This is the question to ask. Will this trend continue and if so, what are the repercussions for the school? It is very unlikely to expect that the school would stabilize for next year after such a large drop. I have no data to compare this to as such a large drop has never happened in our area and I have not found any school with such a large decline.
In general success breeds success and failure breeds failure. Unless a substantial turnaround in the school is made AND effectively advertised, the odds of stopping the decline are likely low.
The Finances:
Benton Harbor Charter is in trouble. Severe trouble. For the 2025-26 year they are projecting to run a deficit of $587,262. They started the year with a fund balance of $1,786,094. If no other changes occur, and they stabilize the student count going forward, they will run out of money in 3 years. Unlike with public schools, there will be no bailouts when the school is no longer solvent. The deficit is roughly 9.5% of current revenues.
While 3 years is what the math says, we can’t assume the math in linear. This is based on no changes in enrollment, while enrollment is in freefall. What happens when BHC loses 80 more students next year? That’s $800,000 in regular funding and an additional hit in Title I funding. This could cause the school to run out of money at the end of next year.
Staffing:
For the 2024-25 year the school had FTE (Full time equivalent) staff of:
- Administrators: 3.3 (4%)
- Teachers: 34 (41%)
- Parapros: 20 (24%)
- Non Instructional: 25.5 (31%)
- With 418 students and 82.8 FTE staff in 2024/25 this is 1 employee for every 5 students. If no cuts have taken place with the 2025-26 enrollment drop, then BHC would be at 1 employee for every 4 students. Other schools in the area like Coloma and Countryside are at 1 employee for every 8 students.
- Currently the district has 10 job openings published.

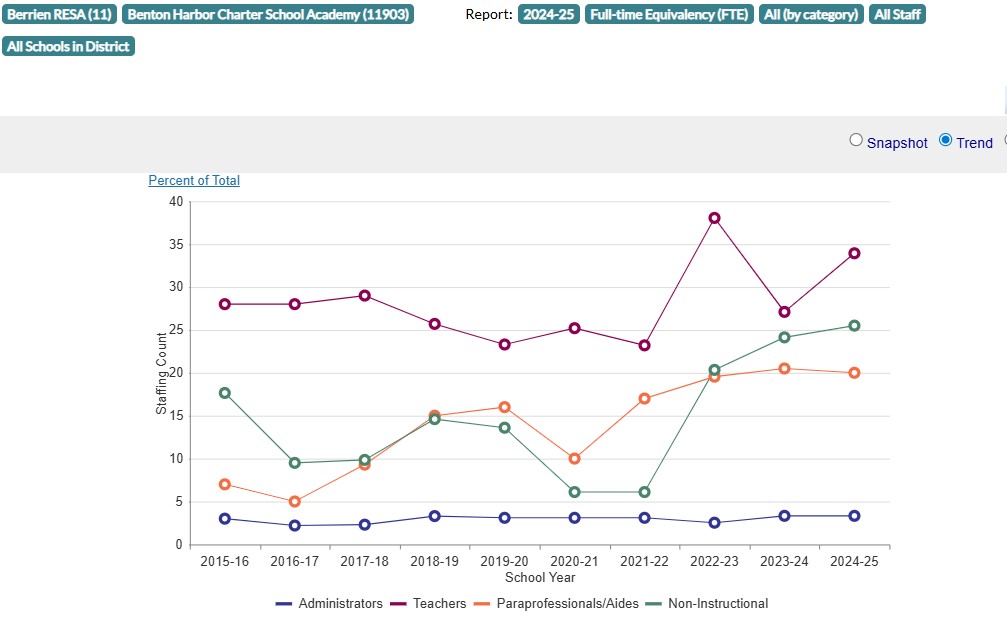
BHC has seen a large increase in non instructional staff, increasing from 6 in 2021-22 to 25 in 2024-25. BHC can not afford to move slow with staff changes like BHAS has been in the past. Without quick action the deficit will eat them alive. Schools often increase headcount quickly when running a surplus and are slow to decrease headcounts when running a deficit.
Facilities:
The school converted an old K-Mart building on Riverview drive into a school. They paid $5 million for the building in June of 2002 and took out financing for $6,710,000 to include the conversion. The school had occupied the building and completed the remodel ahead of the Fall 2000 opening. In 2022 the school refinanced its remaining debt in a new $3,715,416 10 year mortgage. The building is roughly 85,000 square feet. Most schools are built with a capacity design of 150 square feet per student. This would mean the building has a rough capacity of 567 students. It costs the same amount of money to maintain, heat, and light a building regardless of the number of people in it. This drags to efficiency of the school’s finances downward as the cost of supporting the facility is amortized across fewer students.
When looking at the bussing situation, there is a similar problem to the buildings. The busses still have to cover the same routes even if there are fewer children on the busses. The busses still need the same drivers, fuel, and maintenance. The cost does not scale down with fewer students.
I believe they greatly overpaid for the property and find it really hard to justify that cost per square footage in Benton Harbor. Benton Harbor even in 2002 had plenty of large empty buildings.
Another red flag on the building is that in the most recent audit the balance sheet reflects $1.57 million in land and $3 million in buildings net of depreciation. I would argue that the land and the building are way over valued here. The school sits on 11.8 acres in downtown Benton Harbor. A nearby 4 acre parcel of vacant land is assessed as being worth $95,600, a value of $23,900 per acre. If this is an accurate measurement then the land BHC owns is worth $284,410. In general the Benton Harbor Assessors office tends to be on the high side of assessments. I have a parcel that I couldn’t sell for $5,000 that Benton Harbor city says is worth $27,800. I personally doubt the school’s land it is worth even $10,000 an acre. Still using the $284,410 valuation, the school is currently valuing its land at over 5 times its market value.
In total the school is claiming $8 million in assets and $4.5 million in liabilities for a net position of $3.5 million. If the general fund goes to $0 this drops to $1.7 million, BUT if the land were allocated at its actual value then the net position drops to just $410,000.
Long Term Debt:
Long term debt is one positive for the school. The school currently owes $2,638,920 at 3.27% interest. Not only is this a good interest rate and a low amount of long term debt, but it also is amortized to end in March of 2032. The payments on this debt are $436,212 per year. IF Benton Harbor Charter can stay in business until this debt is paid off, they may have a fighting long term chance.
I hate to lose an interest rate this low, but it may make sense from a cashflow standpoint for them to refinance this debt into a long term note. A new 20 year loan for the current balance at today’s interest rates would cut the debt service payments in half.
This is a good example of why in general if interest rates are low it is best to get longer term financing. The debt service payments would be much less if in 2022 when rates were low if they got a 20 year loan instead.
Other Dropping Revenues:
In addition to losing revenue from the state foundation grant of $10,050 per pupil, there are others funds that the district could see go away in the near term.
21h funding: Benton Harbor Charter received $291,000 in 21h funding for underperforming schools from the state for the 2024-25 school year and $369,011 for the 2025-26 school year. This program ends this school year. This reduced funding will be added to the deficit. It is shocking how much BHC received compared to other schools. Benton Harbor Area Schools with 3 times the enrollment received $326,802 in 2024-25, just 12% more than BHC. Detroit Public schools received $1,691,292. They have 48,117 students. Detroit received $35 per student while Benton Harbor Charter received $696 per student. Benton Harbor Charter received 20X as much per pupil as Detroit.
BHC had 418 students of the 1.38 million in the state. This is roughly 1/30 of 1% of the total, but received 3% of the total funding, this is a rate 90 times higher than what proportional would be. This was a sweetheart deal.
Benton Harbor Charter was one of only 45 schools in the state to receive this funding in 2024-25, with a total of $12,000,000 being awarded. This is not the type of program that operates forever. The initial funding for this program ran for three school years. This funding is about to dry up. $369,000 added to next years deficit without spending cuts.
31a At Risk Funds: 31a is a state program that targets “at risk” students and is primary focused on those who count as low income. The vast majority of Benton Harbor residents count as low income.
31a funds are based on the number of students. The formula from 2019 was “Foundation grant X 11.5% X free/reduced lunch count = 31a allocation. If we assume all 332 students qualify for free or reduced lunch, under this formula the math for Benton Harbor Charter would be: $10,050 (2025 foundation grant) X 11.5% X 332 = $383,709.
Effectively each student who counts as low income adds 11.5% to the foundation allowance. This works both ways though. Each student they lost not only caused a reduction in the foundation allowance of $10,050 per pupil, but also an additional $1,155.75 per pupil for 31a funds.
I did find that for the 2025-26 budget it was originally forecast for BHC to receive $568,364 from this program down from $673,920 in 2024. The amended budget for 2025-26 states that funding was awarded at a higher level, adding $124,000 to the budget. The state did increase this funding overall by a massive 25%.
Using this math, the school is receiving $624,364 for 336 students (count at time of amendment) or $1,858.22 each or 18.5% of the foundation allowance.
Between 2017 and 2025 the program has grown from $378 Million to over $1.3 billion. It is now more than double the funding in Michigan for Title I Part A. While the Whitmer administration has increased state spending from $57 Billion to $88 Billion the next Governor may choose to turn this back and programs that saw large jumps in this administration may be the first to get scaled back.
If this goes back to the 11.5% level then the school would receive $383,709, a reduction of $240,000.
It is possible that as soon as 2027-28, without any change in enrollment BHC could be running an additional deficit of $609,000.
Running an example:
For 2026-27 BHC loses half the students they lost this year, a drop in enrollment of 43 students. No changes to staffing have occurred and spending stays static for the school year.
The 2025-26 deficit of $587,262 is our starting point. With 43 fewer students the school loses:
- $432,150 in foundation allowance
- $369,000 in 21h funding (gone regardless of student count)
- $79,903 in 31a funding
This gives us a total deficit for the 2026-27 school year of $1,468,315. This exceeds the $1.2 million in the general fund and the school is now in deficit. There are charter schools that the moment they go negative are immediately closed down. Unlike traditional public schools that will get emergency loans and state managers and bailouts, charter schools will close when they run out of money. The owners would need to either kick in capital or take out a 2nd mortgage on the school.
I think it is likely that the school will cut spending enough to not fully empty the general fund in the 2026-27 school year, but for the 2027-28 school year it is questionable. It really all depends on student count. If they do lose 20%+ again next year it could be the end. Benton Harbor Charter is in a rough spot with its educational results, its relationships with parents and students in the community, and its finances. The question remains, will BHC be able to survive?
What do you think about Benton Harbor Charter’s struggles? Do you think the school will shut down in the near future? Are you a parent of kids who are or who have attended Benton Harbor Charter? What are your thoughts on the school?
Leave a Reply